What is API Monitoring?
API monitoring tools detect API failures by making requests to endpoints at specified intervals and by checking the validity of their response data.


API monitoring tools detect API failures by making requests to endpoints at specified intervals and by checking the validity of their response data.
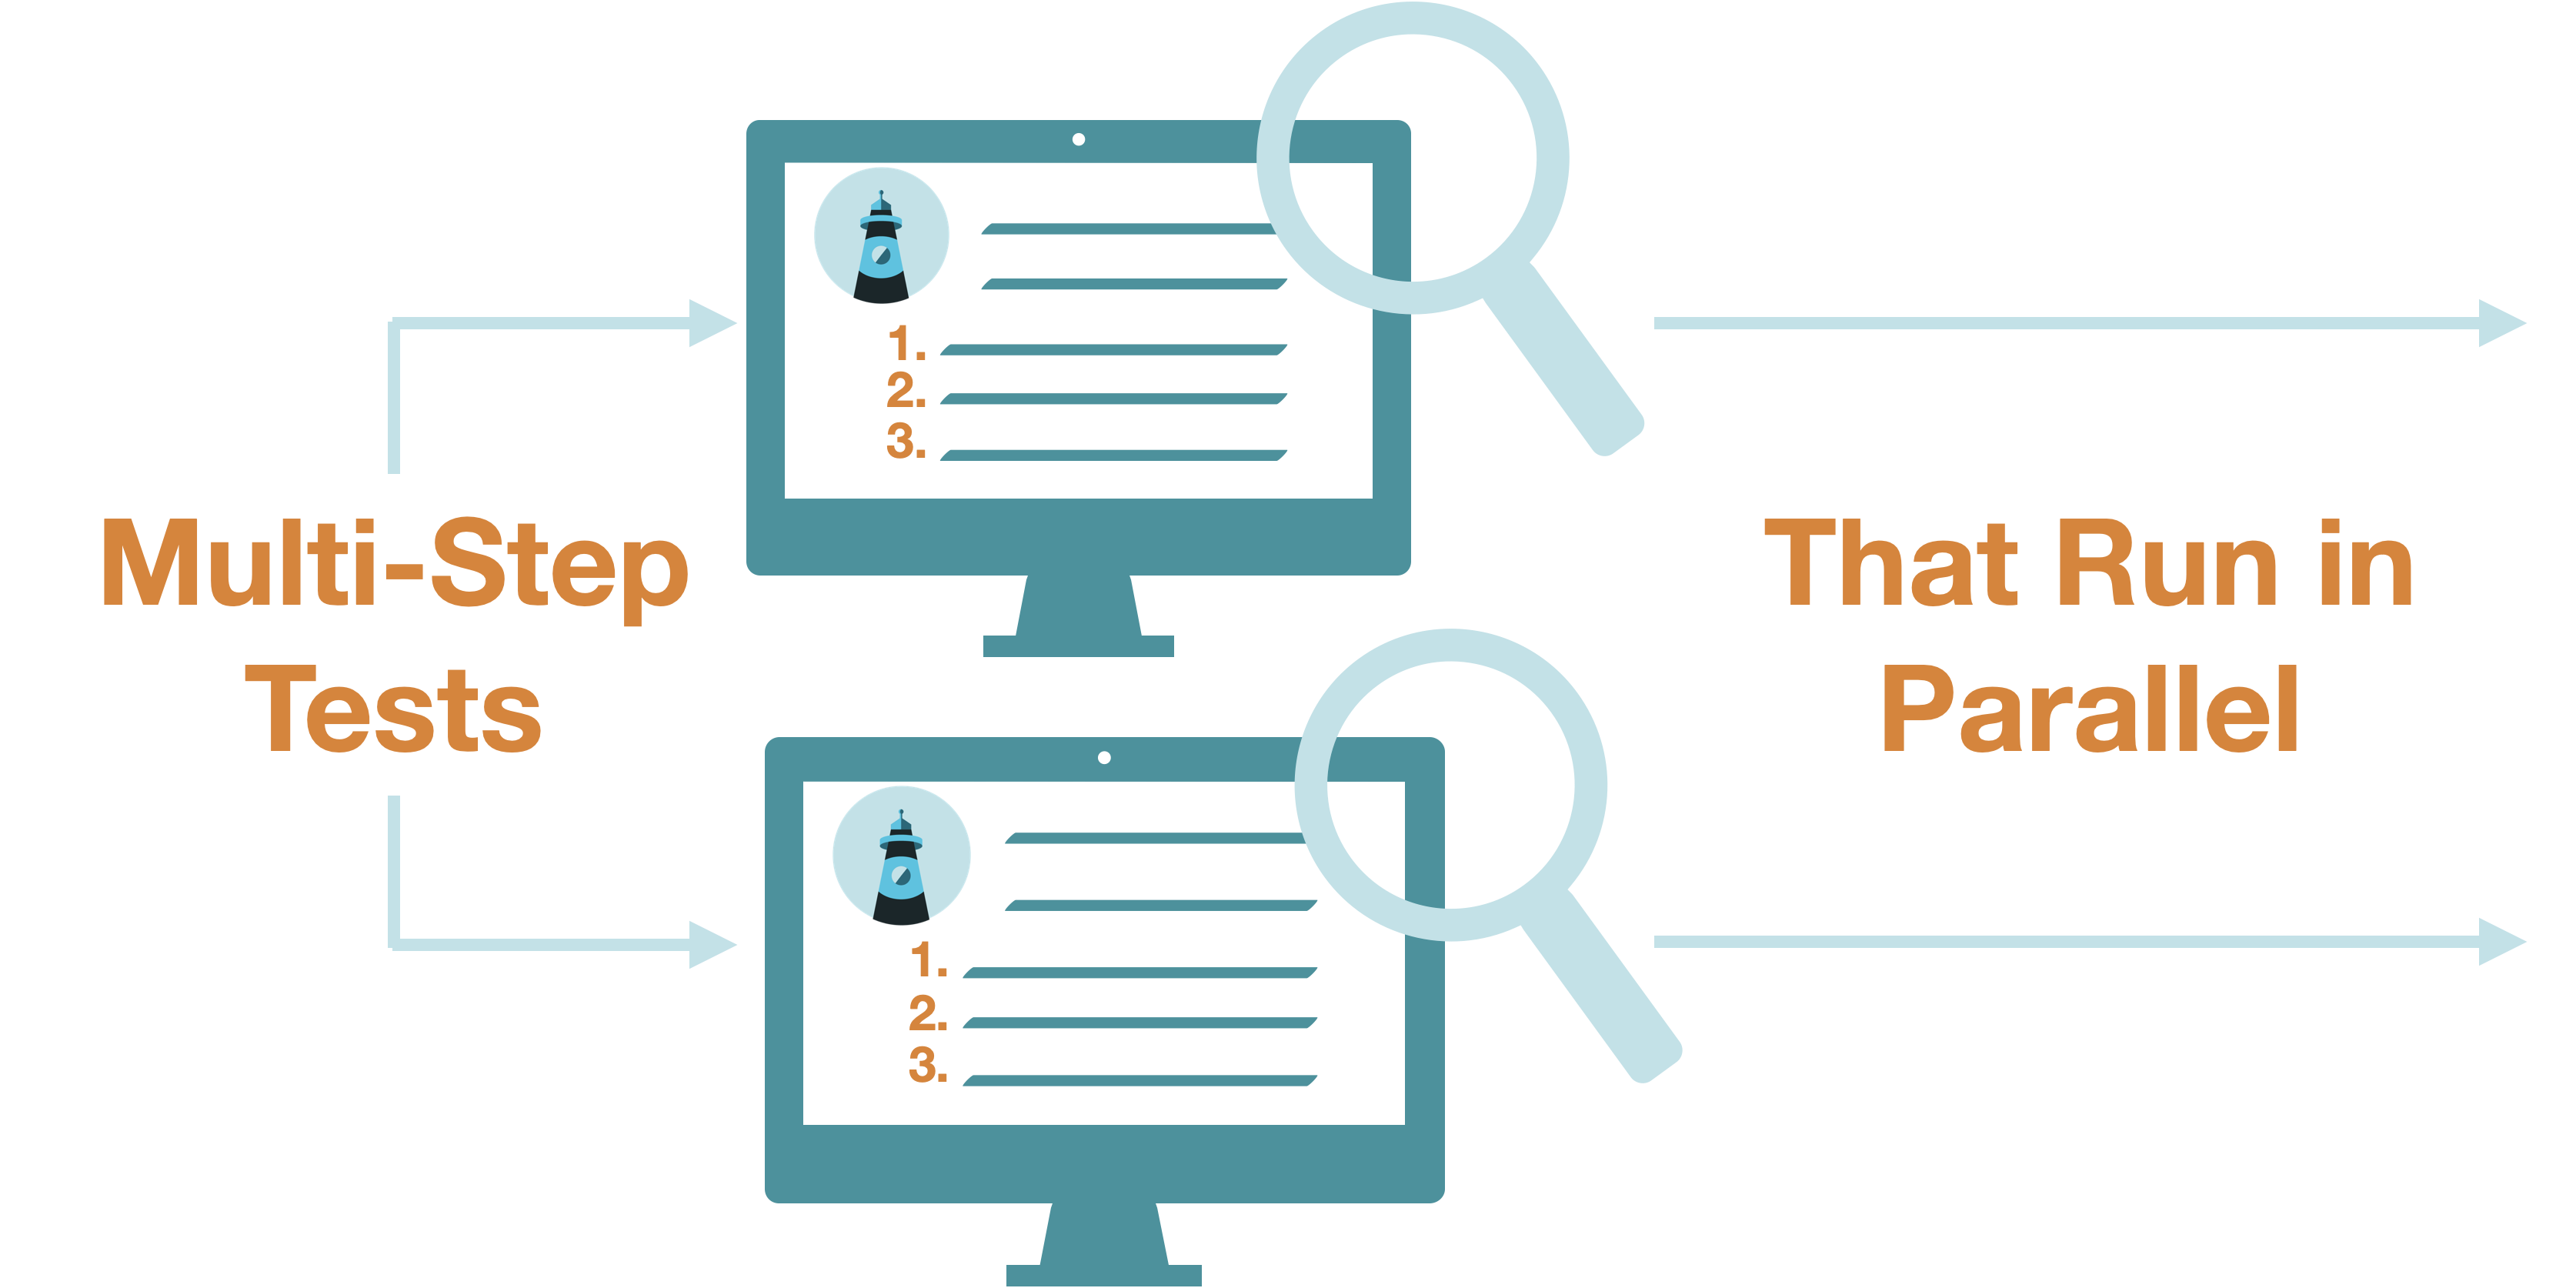
Skopos is an open-source API monitoring tool designed for testing multi-step API workflows in sequence and independent workflows in parallel
Modern software depends heavily on APIs - both internal APIs and external APIs, such as Stripe or Mailgun - for critical functionality and key business transactions. However, relying on APIs is not without risks - software can change, the network is unreliable, and mistakes happen. How can we be sure that APIs are available and behaving as expected?
Through API monitoring, we can observe business-critical APIs and inter-API interactions in production by testing workflows and verify we are getting the expected results. We may not be able to avoid API failures, but we can try to catch issues quickly and minimize their impact.
In this case study, we describe how we built Skopos, a free, open-source API monitoring tool. We designed Skopos to make it easy to keep an eye on multi-step API workflows and respond quickly to failures. First, let's explore why APIs fail and the consequences for applications that consume them.
APIs play a vital role at the heart of almost every piece of technology in use today. APIs can improve functionality and allow easy integration of new features into existing products and services. APIs act as the connective tissue that links together different technology ecosystems.1
Consider a simple weather app that allows users to see current and future weather forecasts worldwide. This weather application relies upon APIs provided by weather services, such as OpenWeather, to retrieve up-to-date weather information for users. OpenWeather in turn sources its data from agencies like NOAA and the National Weather Service, which offer their own APIs to access their data.
APIs act as the connective tissue that binds together the services comprising modern applications. However, this reliance raises an important question: what happens if they fail?

When a company’s APIs fail, it can have cascading effects across other services that had integrated and relied on those APIs.2 To illustrate this, we will briefly describe three high-profile examples.
In 2019, Paytm, a payment service used by UberEats, made an unannounced update to an API endpoint so that the endpoint no longer behaved idempotently.3 Before the change, Paytm's API endpoint always returned the same error when attempting to charge a wallet with insufficient funds to cover the cost of the order. After the change, Paytm returned different messages for the first and the subsequent attempts at charging a wallet with insufficient funds. This unexpected behavior changed how the UberEats’ integration with the API responded to the error.
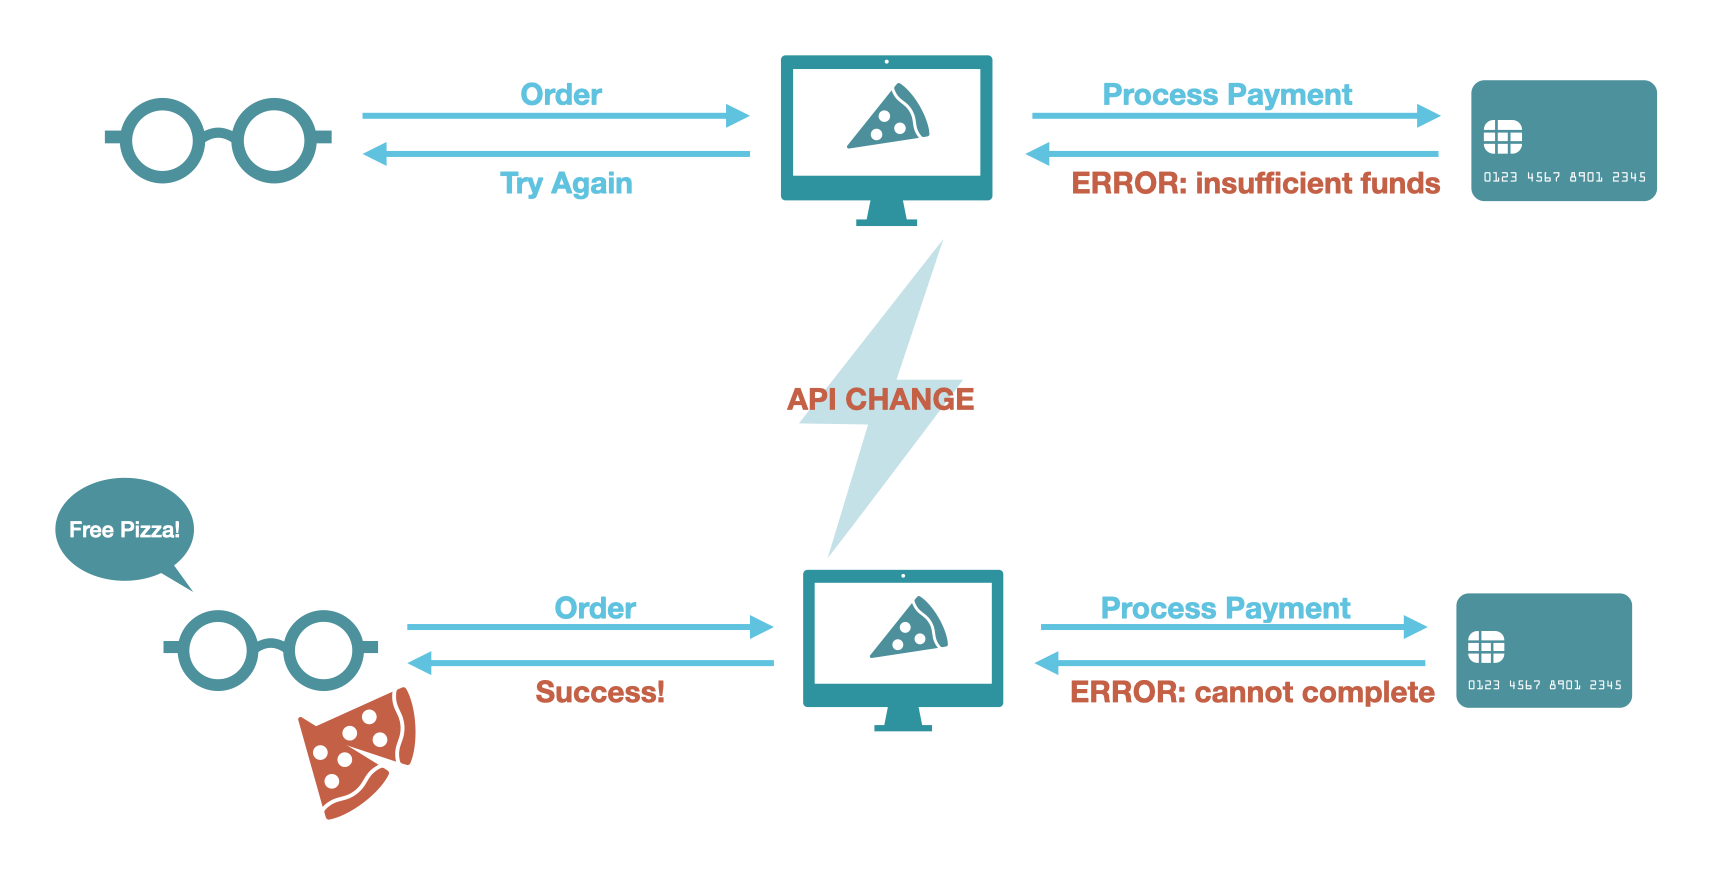
UberEats’ software did not interpret this unexpected response as an error and completed the customer’s order anyway, resulting in free food for the customer. News of the glitch spread fast, and tens of thousands of dollars of orders were placed for free!
From this UberEats example, it is clear that API failures can manifest in an unexpected payload.
In 2019, an incident caused severe degradation of Stripe’s API performance.4 What began as database bugs and a configuration change resulted in a cascade of failures across critical services, including their API. As a result, during this incident, a majority of requests to Stripe’s API either outright failed or suffered greatly elevated response times.
The outage financially impacted both Stripe itself, since it charges a fee on payments it processes, as well as small businesses that rely on Stripe; one startup claimed roughly $100,000 in lost sales.5
From this Stripe example, it is clear that API failures can manifest in error responses and unacceptable response times.
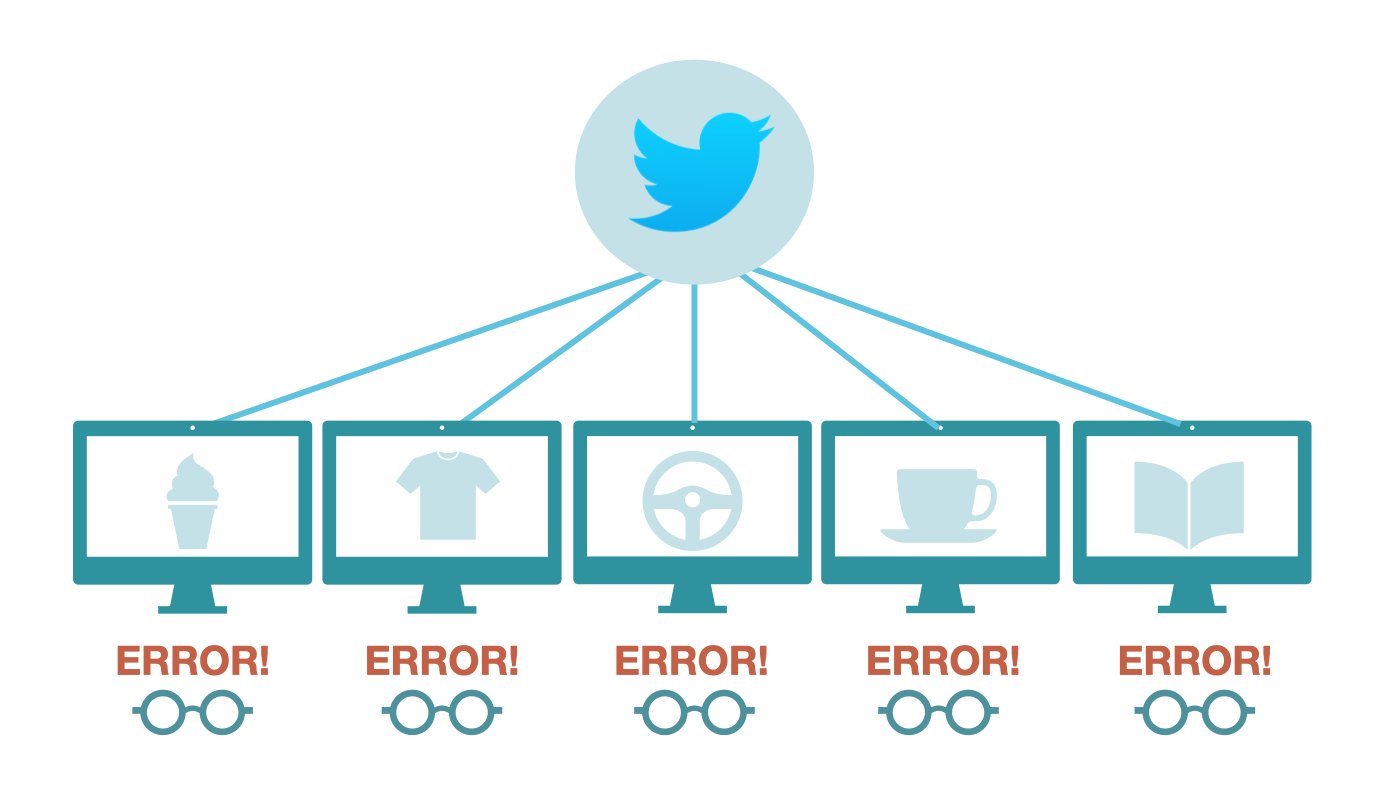
In 2016, Twitter suffered an incident that saw four of its five public-facing APIs experience either performance issues or severe disruption.6 The affected APIs returned status codes and responses stating that they were either “over capacity” or had suffered an “internal error.” During the outages, businesses relying on Twitter for live customer feedback lost valuable marketing insight.
From this Twitter example, it is clear that API failures can manifest in error responses and different status codes.
These were just three instances of API failures, but there is no shortage of examples. Moreover, when an API fails, the implications for software that relies on that API can be dire, from negatively impacting user experience to compromising revenue.
To mitigate the impacts of these problems, companies have invested in tools that track the live performance of relied-upon API endpoints. The key candidates for tracking are:
While the tools designed for tracking these key features of API endpoint performance are fine-tuned to fulfill different use cases, they come with a core set of functionalities, and all fall under the banner of API monitoring.
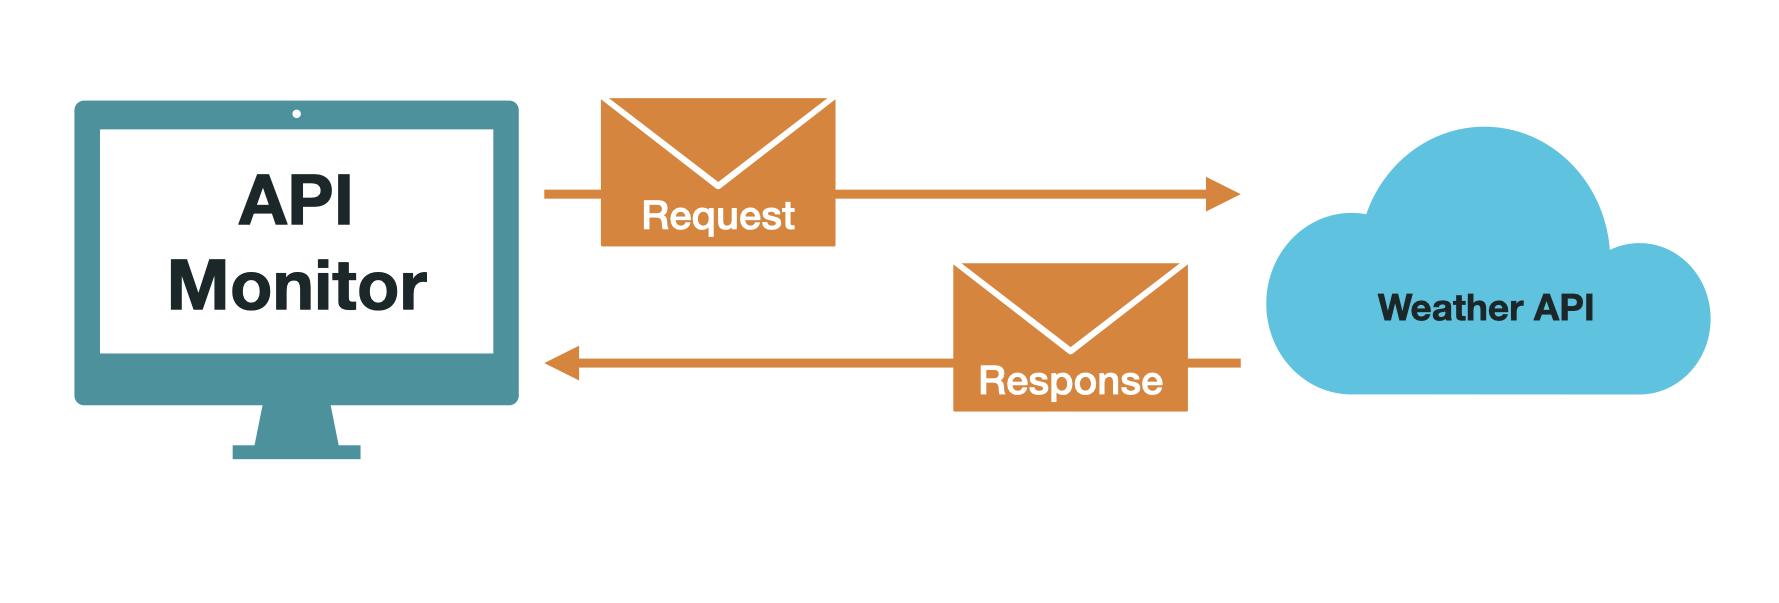
API monitoring is the process of making requests to API endpoints at set intervals and comparing the response to expected values to check both the availability of API endpoints and the validity of their response data.7 The goal of API monitoring is to spot issues that may affect users as early as possible.
For this case study, we refer to requests made to API endpoints to monitor that API's performance as API tests or simply tests.
While API monitoring tools may vary in their specific implementations and use cases, API monitoring tools share a core set of functionalities that are necessary to regularly check API endpoints and provide actionable data on their status. These core functionalities can be broken down at a broad level as a set of distinct steps. We chose to describe these steps as Definition, Execution, Scheduling, and Notification. In the following subsections, we will detail each of these steps.

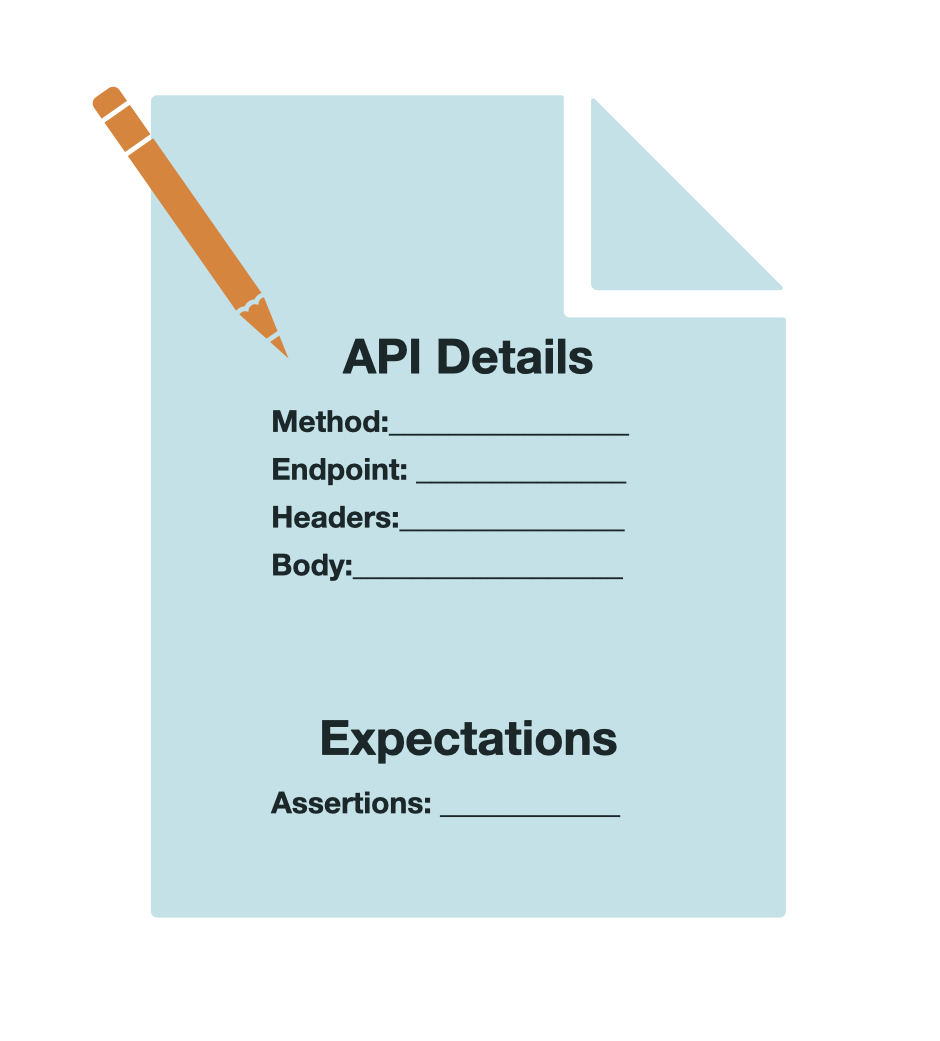
Every API monitoring tool must create tests that define what is being monitored and include all relevant information necessary to perform those tests. This information would consist of the API endpoint to send a request to, the HTTP method to be used, any required headers, and the request’s body.
To facilitate this, an API monitoring tool must have a way of creating tests either via a user interface (UI) or with code. The user provides the above information required for a complete and functional test definition, and the tool defines the test.
An API monitoring tool must also create assertions for tests. In this context, an assertion is a logical statement describing what is expected in response from the API endpoint. The API monitoring tool can then, at a later stage, compare the expected value specified in the assertion with the actual values returned to identify if any failure has occurred. It may be useful to note here that because assertions are specified by the user, the API monitoring tool does not itself decide what constitutes a failure of an API - that is up to the user.
Every API monitoring tool must be able to execute previously defined tests. In this context, execute refers to using a protocol like HTTP to communicate with an API, receive a response, and then process the response appropriately. In processing, the API monitoring tool compares received values to any expected values specified as assertions. Assertions can be either explicit such as verifying that a response body has a specific value, or implicit such as simply expecting test execution to complete without error. The API monitoring tool then determines whether the assertion passed or failed.
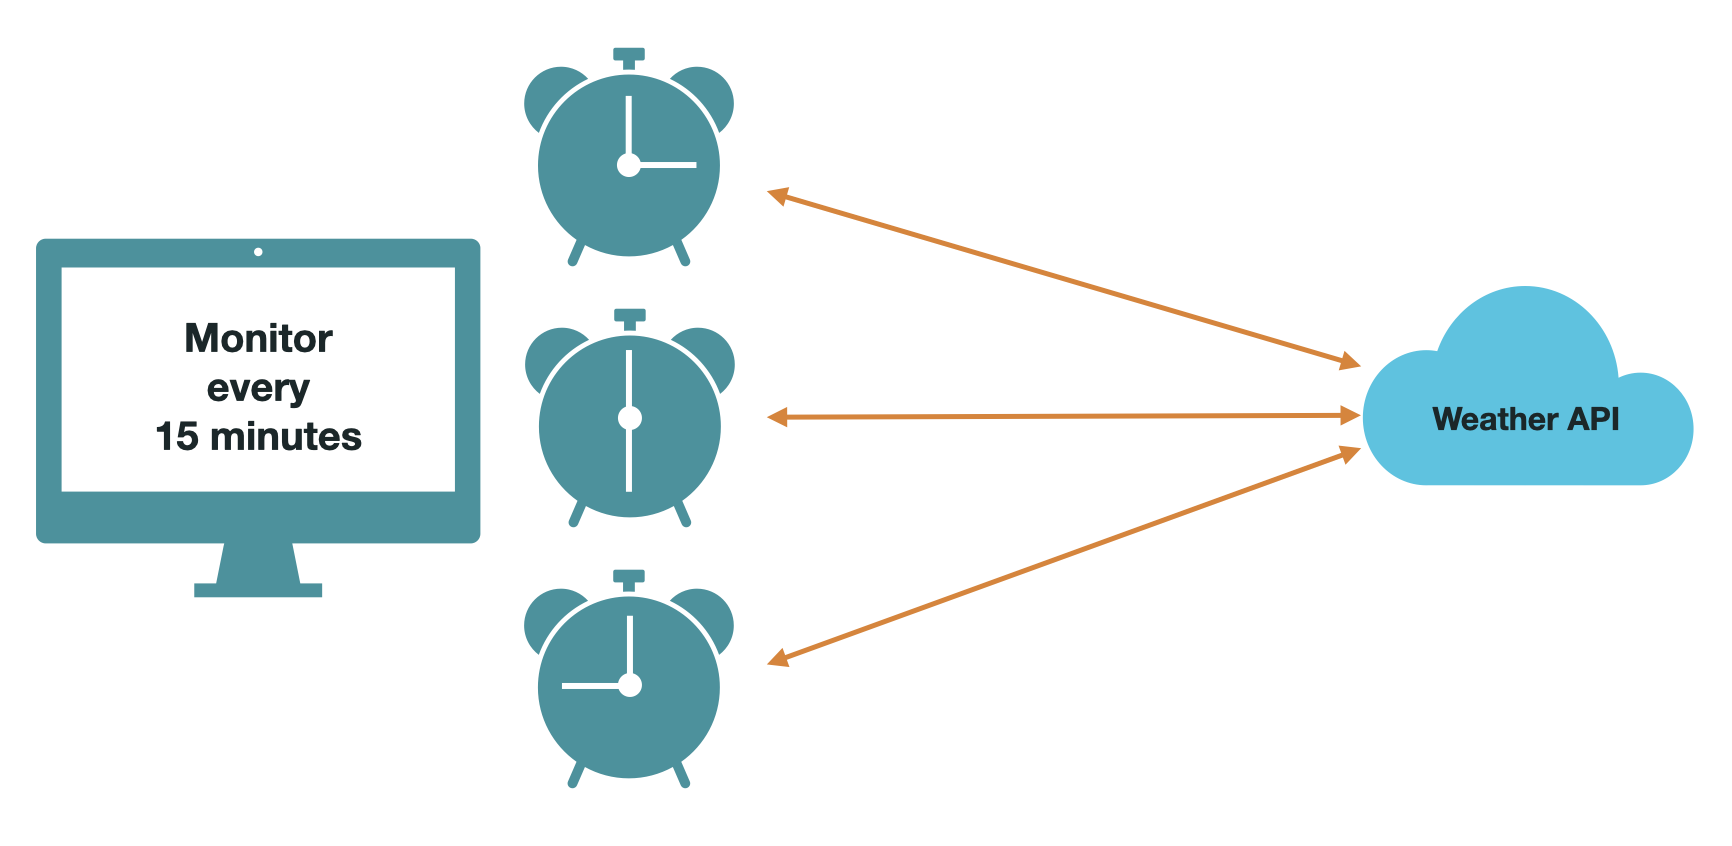
Every API monitoring tool must allow for the automation of tests rather than only providing functionality for a user to run the tests manually. Through scheduling, an API monitoring tool can regularly run tests to catch errors quickly should they occur.
Scheduling in this context is not limited to a time-based schedule but refers to a broader concept of setting a pattern to execute tests in a particular manner automatically. This includes time-based scheduling, but it also includes other patterns. For example, a trigger-based pattern could execute tests as part of a deployment in a CI/CD pipeline, or a location-based pattern could have tests originate from different locations around the globe.
The scheduling patterns an API monitoring tool offers will depend on the specific use case the tool addresses.
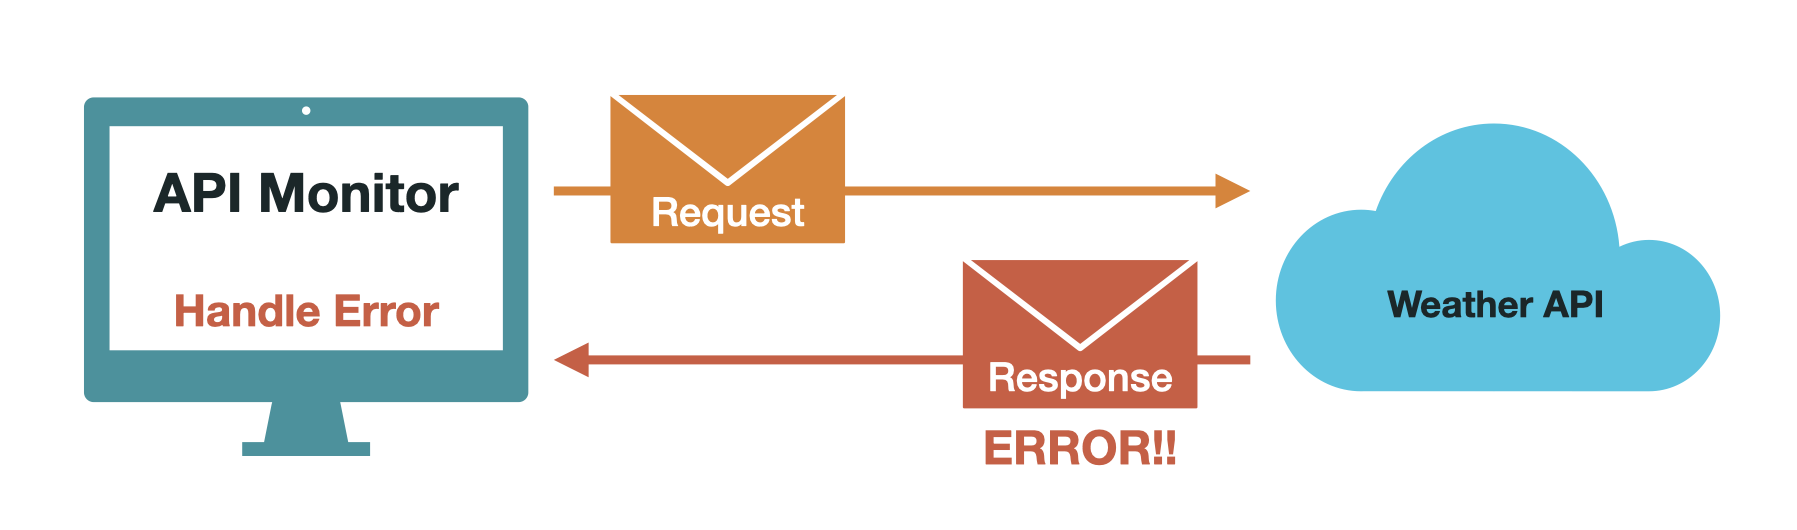
Every API monitoring tool must recognize and report discrepancies between actual and expected response values. For monitoring to be useful, it needs to provide actionable information about the status of the API endpoints being monitored. Some tools may use self-healing mechanisms to resolve these discrepancies, while others rely on user intervention for resolution, in which case notifications can be sent to the user of the monitoring tool. The notification methods can vary depending on specific implementation; popular ways to notify user agents of API monitoring tools include Slack webhooks and SMS.
While API monitoring tools have core commonalities, they are not generally one-size-fits-all products. There are different use cases to account for, and services often offer different features. Knowing which features to target for a company depends on which approach to API monitoring makes the most sense for their specific use case. Let us now explore how these core functionalities are fine-tuned in different ways to fit different use cases.
Below are examples of features commonly offered by API monitoring tools and which use cases they are best suited to handle. These features typically work by changing the functionality of one or more of the steps defined above.
Multi-step tests allow for tests to be linked to each other. This way, a subsequent test can refer to values from the responses to previous tests. In the context of the four steps of API monitoring, with multi-step tests, the user now defines the previous values they wish to access, and the execution of the test must execute tests in sequence and track state. This is typically used when different services of an application need to communicate with one another in sequence over API calls to complete common functionality, such as an API endpoint requiring authentication through a token.8 API call chaining like this is particularly prevalent with a microservices architecture.
A trade-off of this approach is that multi-step tests must be run sequentially and depend on each other, which can make tests inefficient and possibly more error-prone.
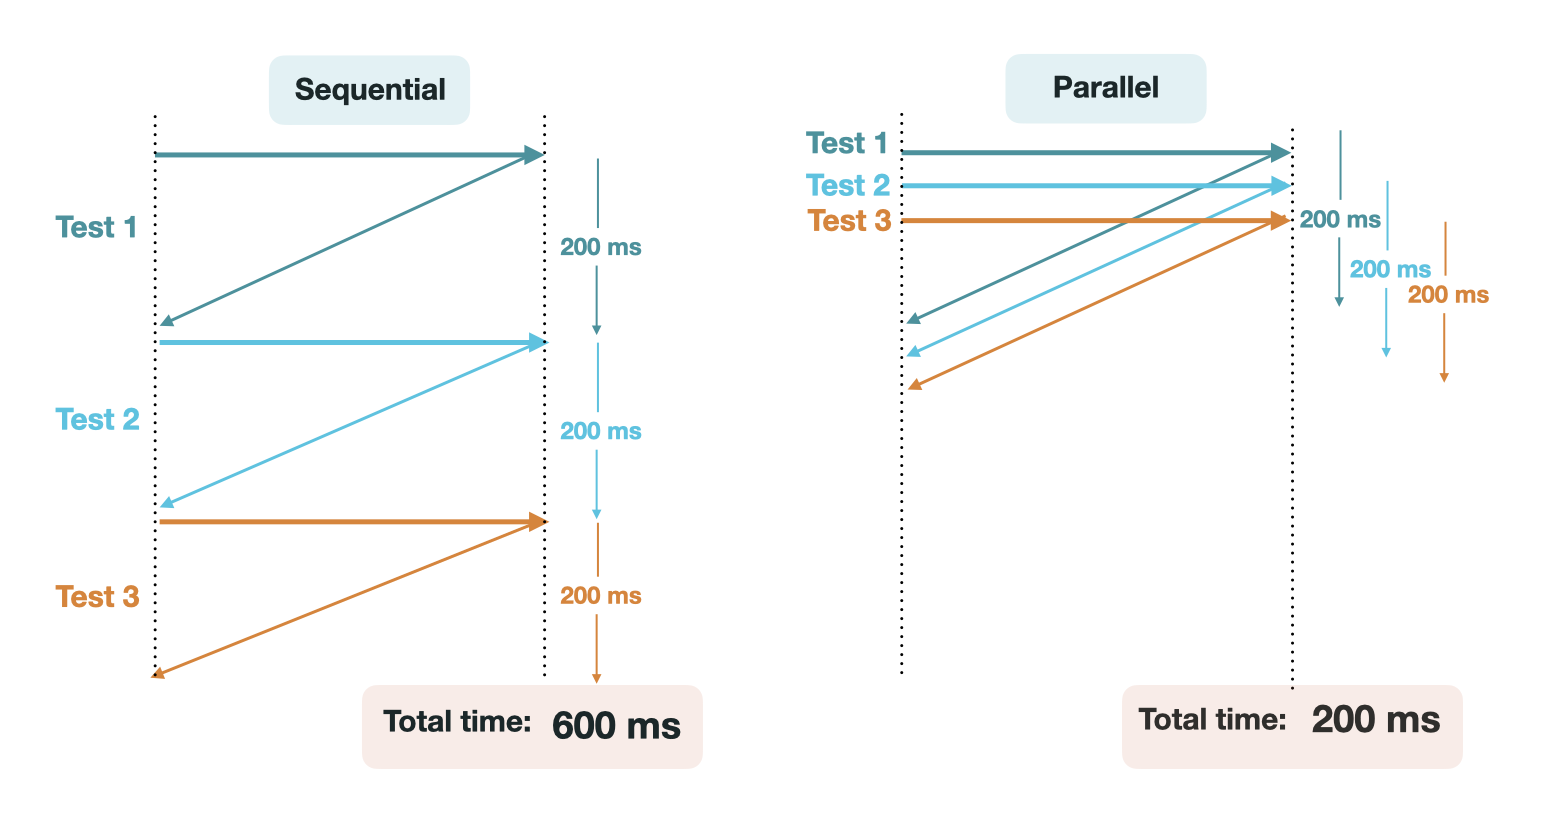
API monitoring tools that offer parallel tests allow many tests to be run simultaneously. In the context of the four steps of API monitoring, with parallel tests, the execution of tests occurs in isolated sandboxes. If these tests are being sent to the same endpoint, this feature can be used for load testing to see how an application responds to many requests received in a short period of time. If these tests are being sent to different endpoints, this feature can save time when running a large number of tests.9
One trade-off to this approach is that when tests are executed in parallel, it is much more challenging to set up complex API tests, and those with prerequisites typically require setup with user-defined scripting. Additionally, orchestrating parallel tests requires provisioning multiple resources to carry out execution simultaneously.
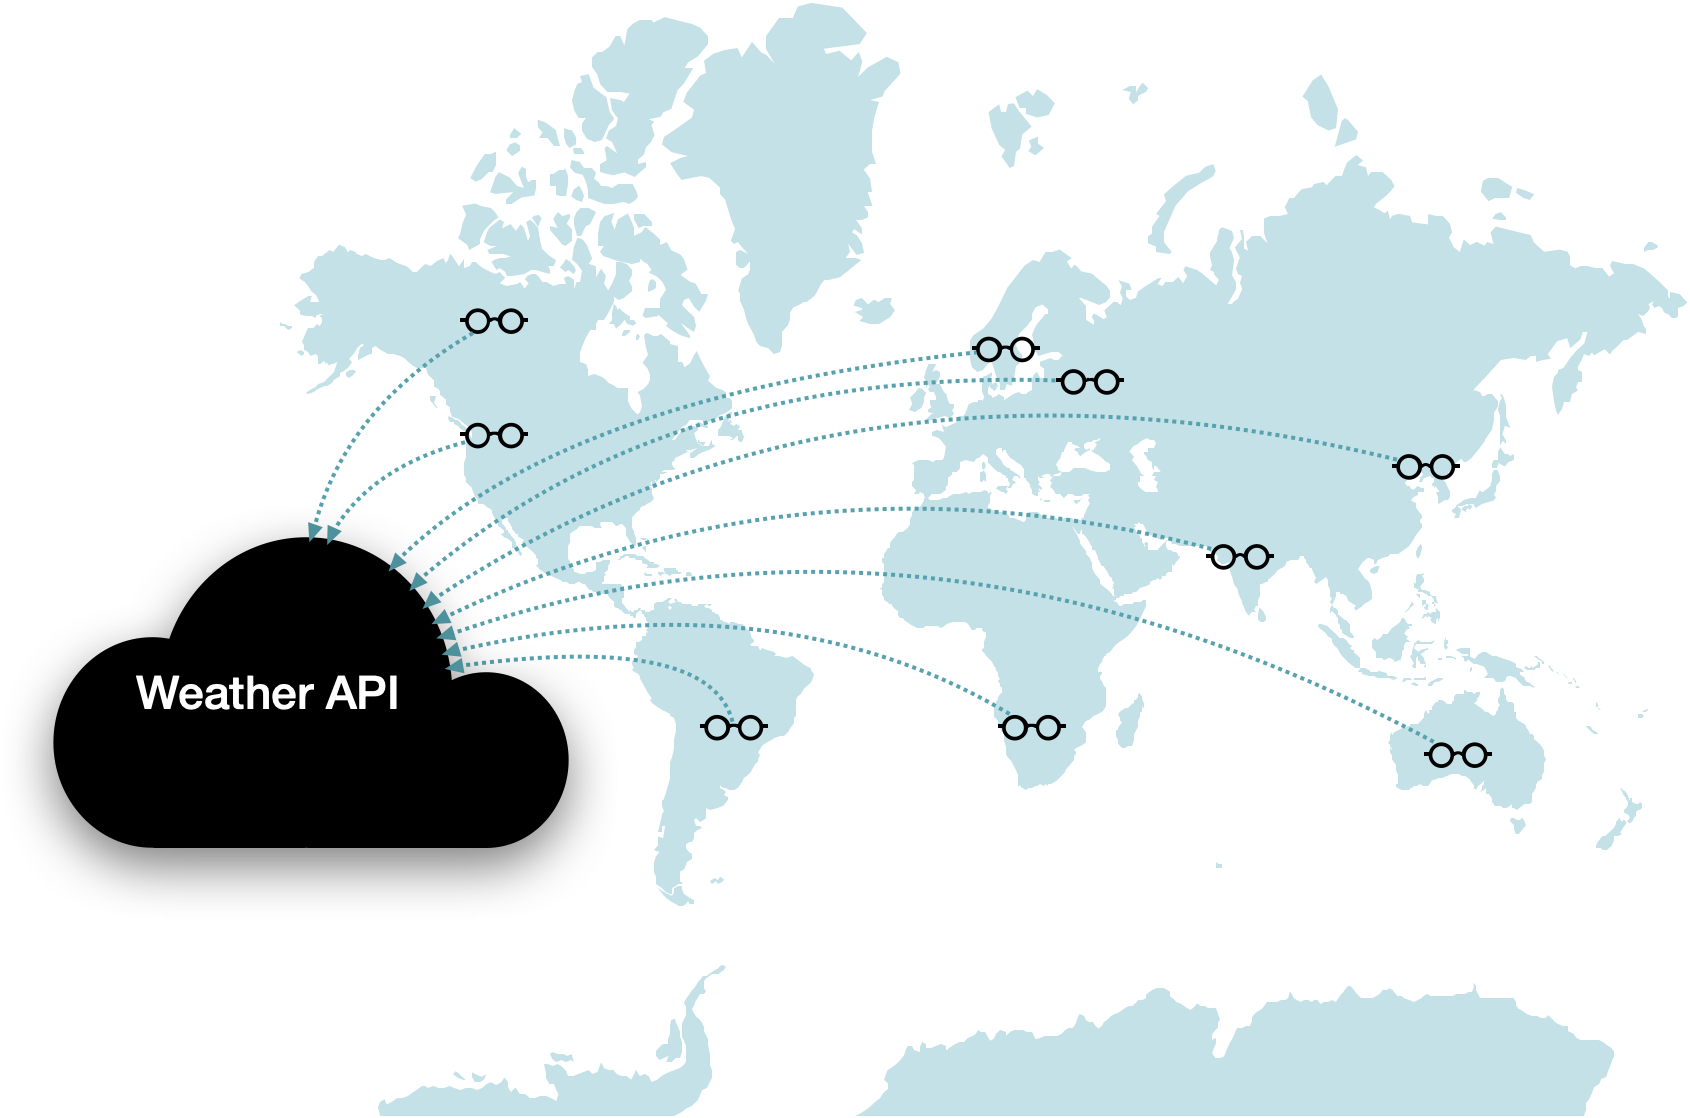
Applications with global users may want to test the performance of their APIs in varying geographical locations. Monitoring tools that offer this allow for specifying different locations for requests to originate. When considering the four steps of API monitoring, with geo-location-based tests, scheduling includes selecting locations rather than just times, and execution occurs in different locations. This provides insight into how an API is performing for varied users, particularly that response time is acceptable and response status codes are as expected. This helps to better diagnose if an issue is network-related, and is especially helpful for public-facing APIs that users interact with directly.10
A trade-off of this approach is that resources must be provisioned and managed in each location tests are to be executed.
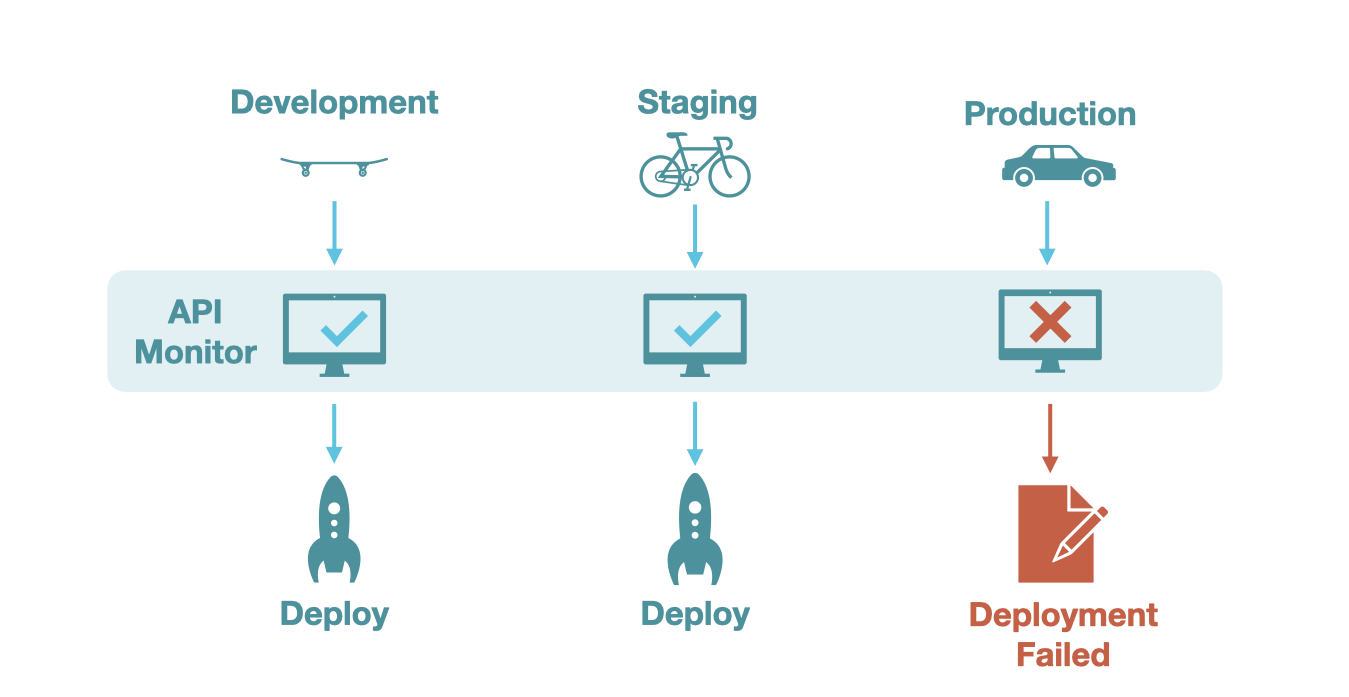
API monitoring tools can also allow integration with CI/CD pipelines, often by linking collections to multiple environments and setting deployment triggers that automatically run tests in these environments in response to new builds. In the four steps of API monitoring, with CI/CD integration, the scheduling involves deployment triggers rather than time-based scheduling, and the execution can occur in different environments. This is helpful to ensure that API integrations do not break amidst frequent codebase changes.11 Often, CI/CD integration tests are used with APIs that have internal endpoints that other mission-critical components rely on.
One trade-off of this approach is that CI/CD integrated tests only check that endpoints are functional at the point of deployment and do not provide insight into API availability across time.
Each of these approaches is useful for different applications, though care must be taken to choose the best tool for one’s specific requirements. For instance, consider two applications that both publish their own public-facing APIs: one frequently deploys updates to their codebase but only markets their API in one region, while the other deploys new versions infrequently but offers its APIs to users in several different geographic locations. Where one may benefit from CI/CD integrated API monitoring, the other may benefit more from geo-location-based monitoring.
It is worth noting this is not an exhaustive list since with new innovations there are new needs and ways to monitor APIs. These simply form some of the broader categories of API monitoring approaches. In our case, we were searching for an API monitoring solution capable of monitoring multiple API endpoints that rely on multi-step workflows and require high availability.
There are different API monitoring tools currently on the market that offer different features depending on their use case.
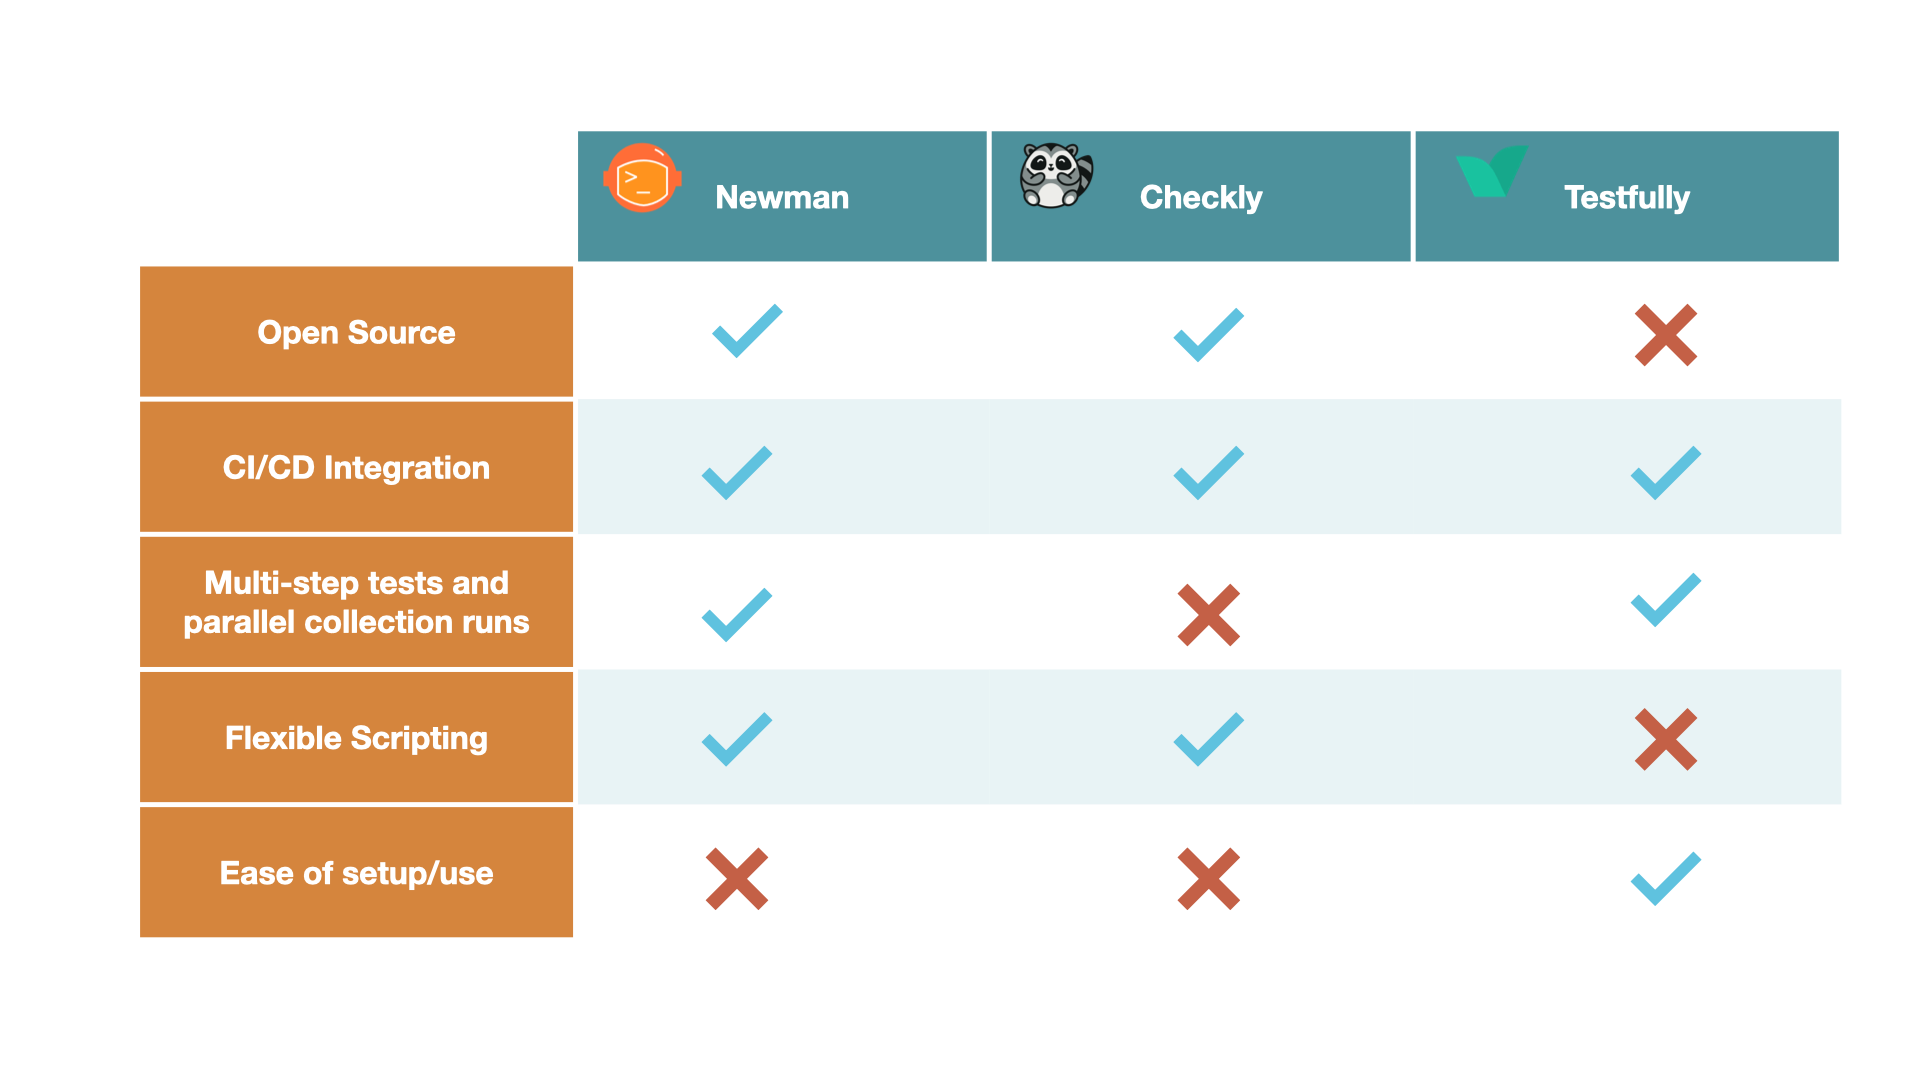
One example is Postman’s Newman CLI tool. This tool can be used for running collections that are created in Postman. As a CLI tool, this allows for increased flexibility in how groups of tests, or collections, are run. For example, this tool can be integrated with others, incorporated into a CI/CD pipeline, or used as a Node.js library. Because of this flexibility, features such as parallel collection runs and multi-step tests can be configured, although they do require writing and maintaining additional code.
The trade-off for increased flexibility with this tool is ease of use. Because this is a command line tool, there is no GUI to interact with. Also, there is a disjointed experience using Newman because tests are created in Postman and then exported into Newman.
Various companies offer SaaS solutions. These tools are generally robust with many features and even provide customer support to help troubleshoot issues. However, many of these features are often behind paywalls and may or may not be open-source.
One commercial solution we looked at is Checkly. This tool has an easy-to-use GUI with extensive dashboards to monitor the results of running tests. However, Checkly does not offer support for multi-step testing out of the box. Instead, tests are considered an isolated unit, and users can write setup and teardown scripts to achieve the functionality of multi-step tests. However, this does require additional code to write and maintain.
Testfully is another commercial solution we looked at; this tool comes very close to what we desired. However, as a commercial solution, it is not open source, so users must be comfortable with a lack of transparency, as well as sacrificing some control over their data. Also, features like Slack integration for notifications, short intervals between test or collection runs, and long-term data retention are locked behind higher payment tiers.
As a reminder, we wanted an API monitoring tool that allowed us to monitor multi-step API workflows requiring high availability.
An essential requirement for us was the ability to run multi-step tests in collections. Within a collection, tests could be dependent on each other and executed sequentially. Separate groups, however, could be run in parallel. This would allow collections to be run more quickly and decrease compute time. For example, if an API workflow has 10 requests with 200ms of latency for each request, running this collection of tests sequentially would take around 2 seconds. If you need to test 50 different workflows, that would take 100 seconds to run collections sequentially. This creates a hard limit for the frequency of running collections that may exceed acceptable downtime.
Another key requirement for us was ease of use; we wanted a tool that allowed developers to implement their API tests and monitor the results with minimal onboarding.
All the tools we looked at only fulfilled a subset of our requirements. For example, Newman CLI could set up multi-step tests that could run in parallel, but it did not have the ease of use we wanted. Using Newman required a developer to write their own test scripts, and collections had to be created in Postman and then exported to use in Newman. Checkly had an easy-to-use GUI, but implementing multi-step functionality required a developer to write their own setup and teardown scripts on each test. Testfully came the closest to satisfying most of our requirements, but it locked its functionality behind high monthly subscription costs. We wanted an open-source solution. Ultimately, none of these tools matched our use case, so we set out to build our own.
Skopos is an open-source API monitoring tool designed for multi-step API testing and running collections of tests in parallel, with a user-friendly interface. We designed Skopos intending to monitor multi-step API workflows that needed to be highly available. With Skopos’ GUI, it is possible to set up multi-step API tests and schedule them to run in short intervals, for example, every minute. Additionally, if several collections are scheduled to run simultaneously, they can run in parallel.
Skopos is not designed for CI/CD integration; since we created Skopos with a focus on monitoring API endpoints in production, CI/CD integration was not central to our goal. Additionally, Skopos lacks any user-defined scripting. While this sacrifices some flexibility in how tests can be defined and executed, we felt expecting a user to write their own scripts would compromise our vision of an easy-to-use tool.
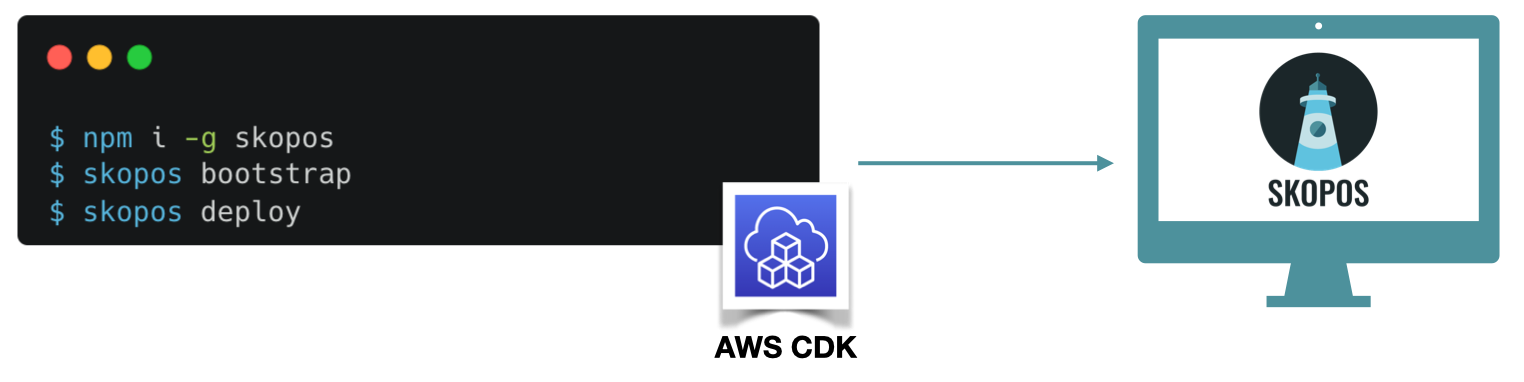
Using Skopos requires:
To install Skopos, run ‘npm install -g skopos’. Then, running ‘skopos deploy’ will deploy Skopos on the user’s AWS account using the AWS CDK. Once this is completed, a URL will be supplied to access the application’s GUI. Through this URL, the user can interact with the React front end hosted in an S3 bucket.
As an API monitoring tool, Skopos incorporates the core functionalities of defining, scheduling, executing, and notifying. Here is a look at how this is implemented with Skopos.
A user can define a test in the following way:
On the collection screen, click the ‘Add Request’ button
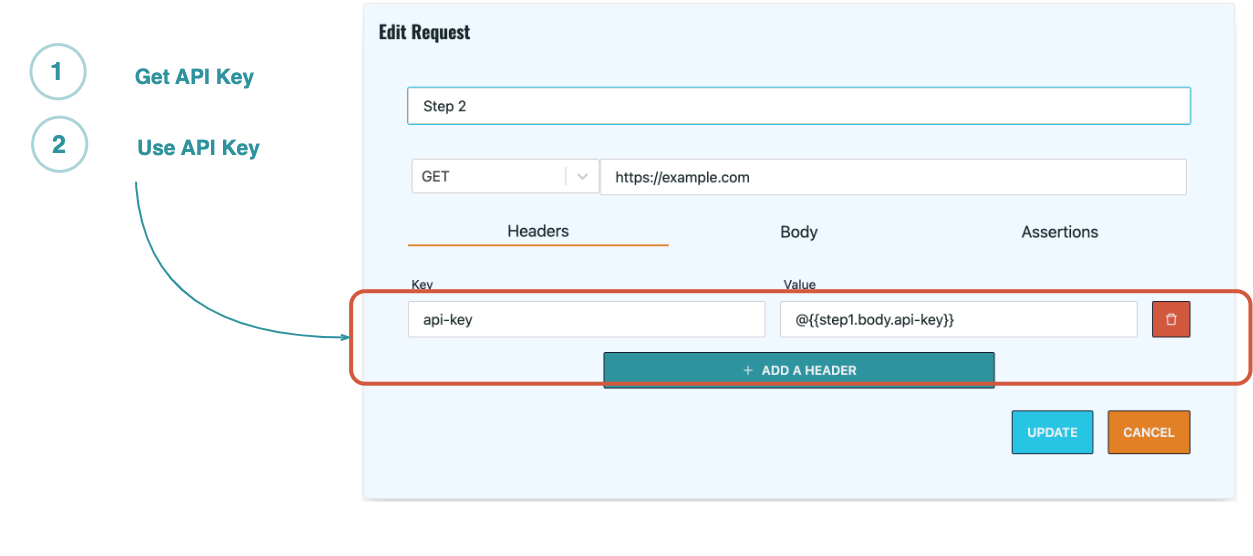
@{{}}) to reference the exact value from
previous requests. For instance, @{{step1.body.sample}} references the value stored in the
sample property of the body received in response to the request defined in step 1.
body.id references the id
property of the body object
When a collection is selected, to run that collection immediately, a user can click the ‘Run Collection’ button. Internally, this sends a request to the collection runner to run the collection. Once test execution has been completed, the results of the execution are displayed. To see the results of past collection runs, click the ‘History’ button in the collection. Tests can also be executed automatically on a schedule.
Tests are scheduled at the collection level. A user can set up a monitoring schedule in the following way:
When assertions fail, notifications can be sent via email, Slack, or PagerDuty.
Having seen how API monitoring with Skopos works and what it can do, we can now explore the design decisions and engineering challenges that went into building this tool, starting with Skopos’ core functionality.
We started by building a proof of concept for running multi-step tests, which would be the core functionality of our API monitoring tool.
Test definition was a natural first step for us to tackle since all subsequent functionality of an API monitoring tool depended on having a test to execute in the first place. For our core application, we focused on facilitating test definition through a GUI and defining multi-step tests.
When we designed the test definition functionality, one of the first decisions we made was to use React for the application's front end. Via text fields and drop-down menus, this React front-end provided a GUI for the user to input the information required to define a test.
To enable multistep tests, we chose to group individual tests into collections, which would be the central functional unit of our application. A collection could be associated with many tests, while a test (referred to as ‘request’ in our schema) could only be associated with one collection, and the tests in one collection could not rely on tests in other collections. When run, tests in a collection would be executed sequentially, and tests would have an associated step number that indicated when they would be executed in relation to the other tests.
Our chief implementation challenge at the test definition stage concerned how to define a test such that when it is later executed as a part of a collection, it can reference response values from previous tests in that collection.
To solve this problem, we first needed a reliable method of flagging to the application that “this value
should reference another value” that was still human-readable and simple enough for a user to take advantage
of. Here we took inspiration from JavaScript’s template literal string interpolation syntax, where in the
string `Hello ${variable}`, the $ symbol and curly brackets indicate that whatever is between the curly
brackets is a variable whose value should be interpolated into the string. In our case, we decided to use
@{{}} as our variable template flag - an @ symbol, followed by a double set of curly brackets.
Once we had established the data model and logic for test definition and implemented a basic front-end user interface to create tests, we needed to store and fetch the resulting data.
Since we aimed to eventually implement scheduling — which would allow tests to execute automatically on short intervals — we anticipated frequently querying this data to execute the tests and display the results. Therefore, the efficiency of these operations was of some concern.
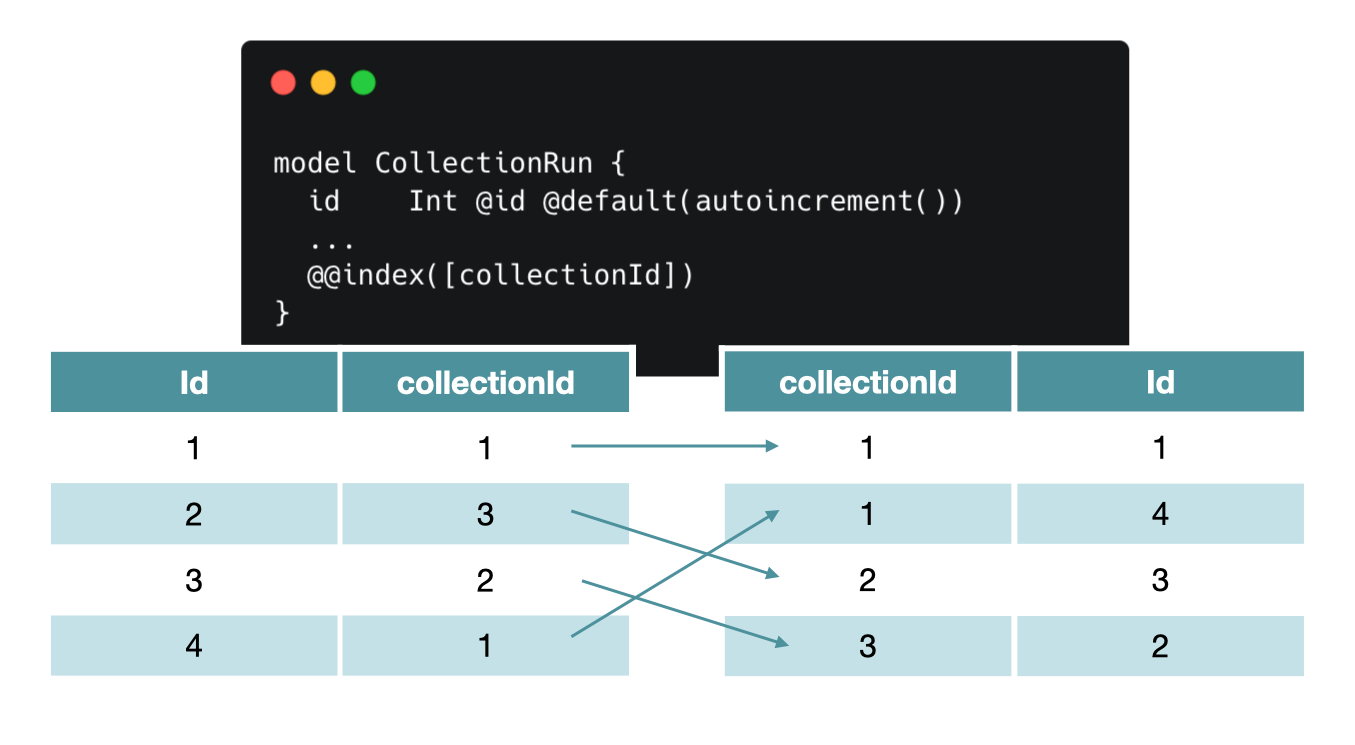
We had detailed our data model in a relational way and were able to easily implement the schema with PostgreSQL. However, as we were developing our definition and execution components, we often had to return to our data model and modify or tweak our schema in some way, so we decided to use Prisma to simplify initializing database schema and migrating schema.
As we progressed in development, working with REST endpoints was limiting. Sometimes, we were fetching resources from multiple endpoints (under-fetching), and other times we were fetching more resources than necessary (over-fetching).
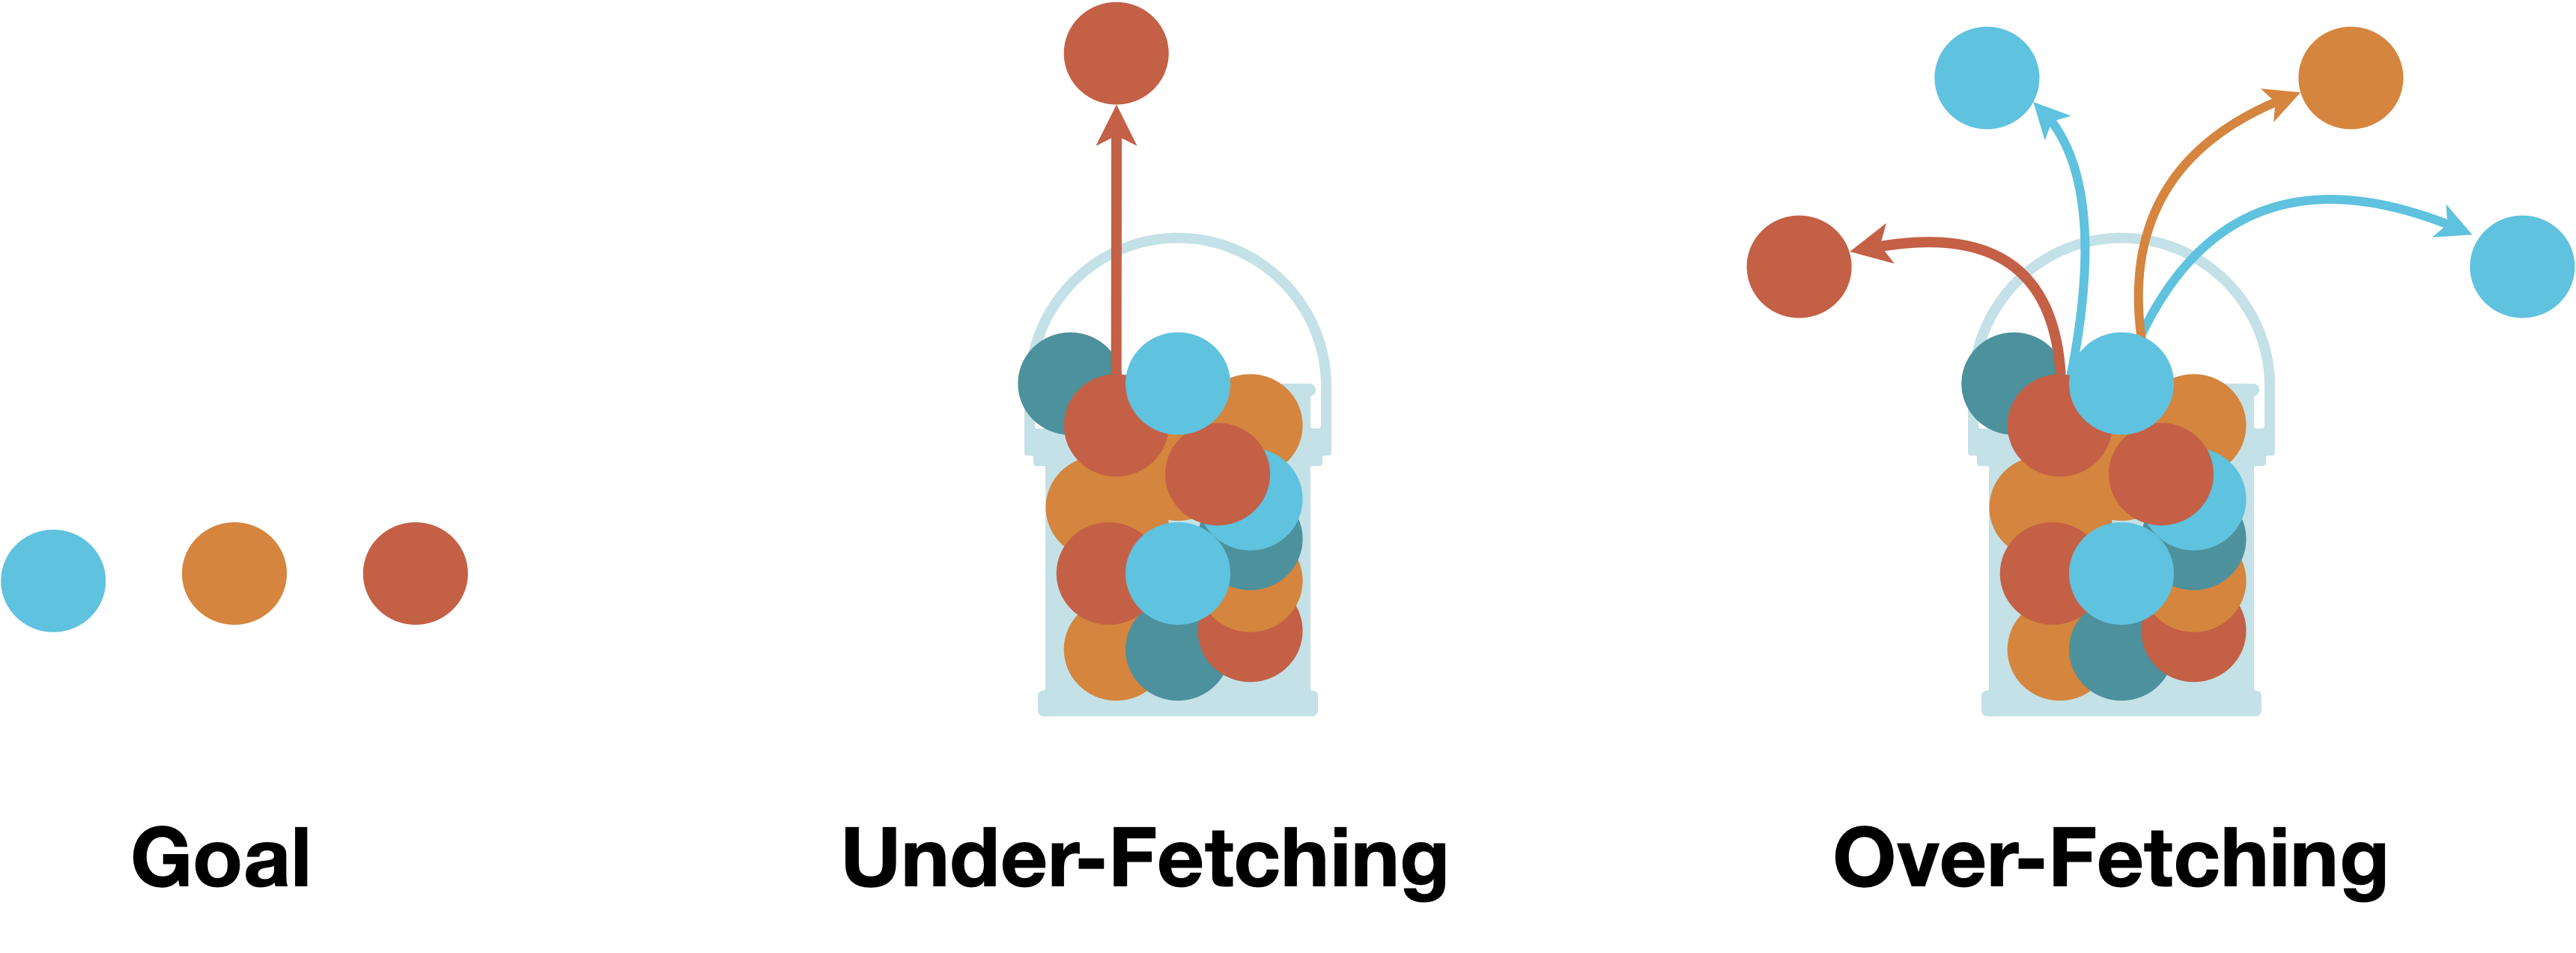
So we began adjusting our queries and endpoints to target only the data we needed. Still, the queries were growing too complex for us to comfortably work with, and the custom endpoints departed from REST implementation.
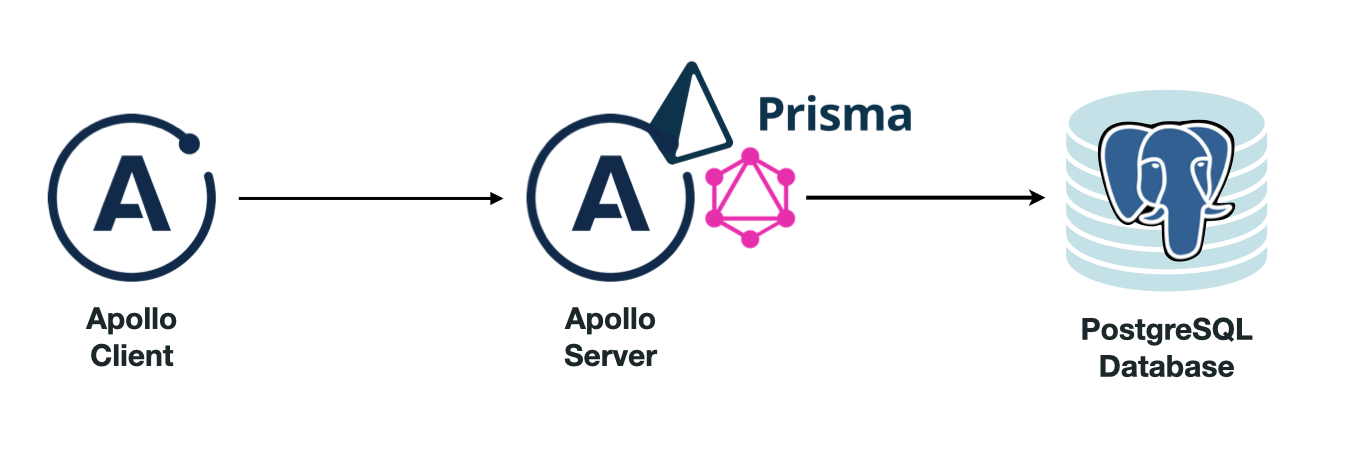
To simplify our queries and avoid over or under-fetching of data, we integrated GraphQL into our data stack. Specifically, we added Apollo Server to our backend app server. Any components that would need to communicate with the database could then use Apollo Client, and the backend running Apollo Server would act as the single gateway to the database. Our final data stack consisted of a PostgreSQL database connected to a backend server running Prisma and GraphQL via Apollo Server.
Once we had our data stack established, we considered some further optimizations we could make:
Now that we were able to define tests and store and query the tests’ data, we needed to be able to execute the tests.
Multi-step tests require running tests in sequence while keeping track of previous responses. Therefore, we had to process requests to access previous values, send new requests, save the response to a collection of responses, and finally check if the assertions passed for the response. Furthermore, if there were any errors in the process, we wanted to handle the error differently based on where the error occurred.
Our main task here was to build a component that would handle running through the tests in a collection and execute them in sequence with all associated pre- and post-processing required. We appropriately termed this component the ‘collection runner.’
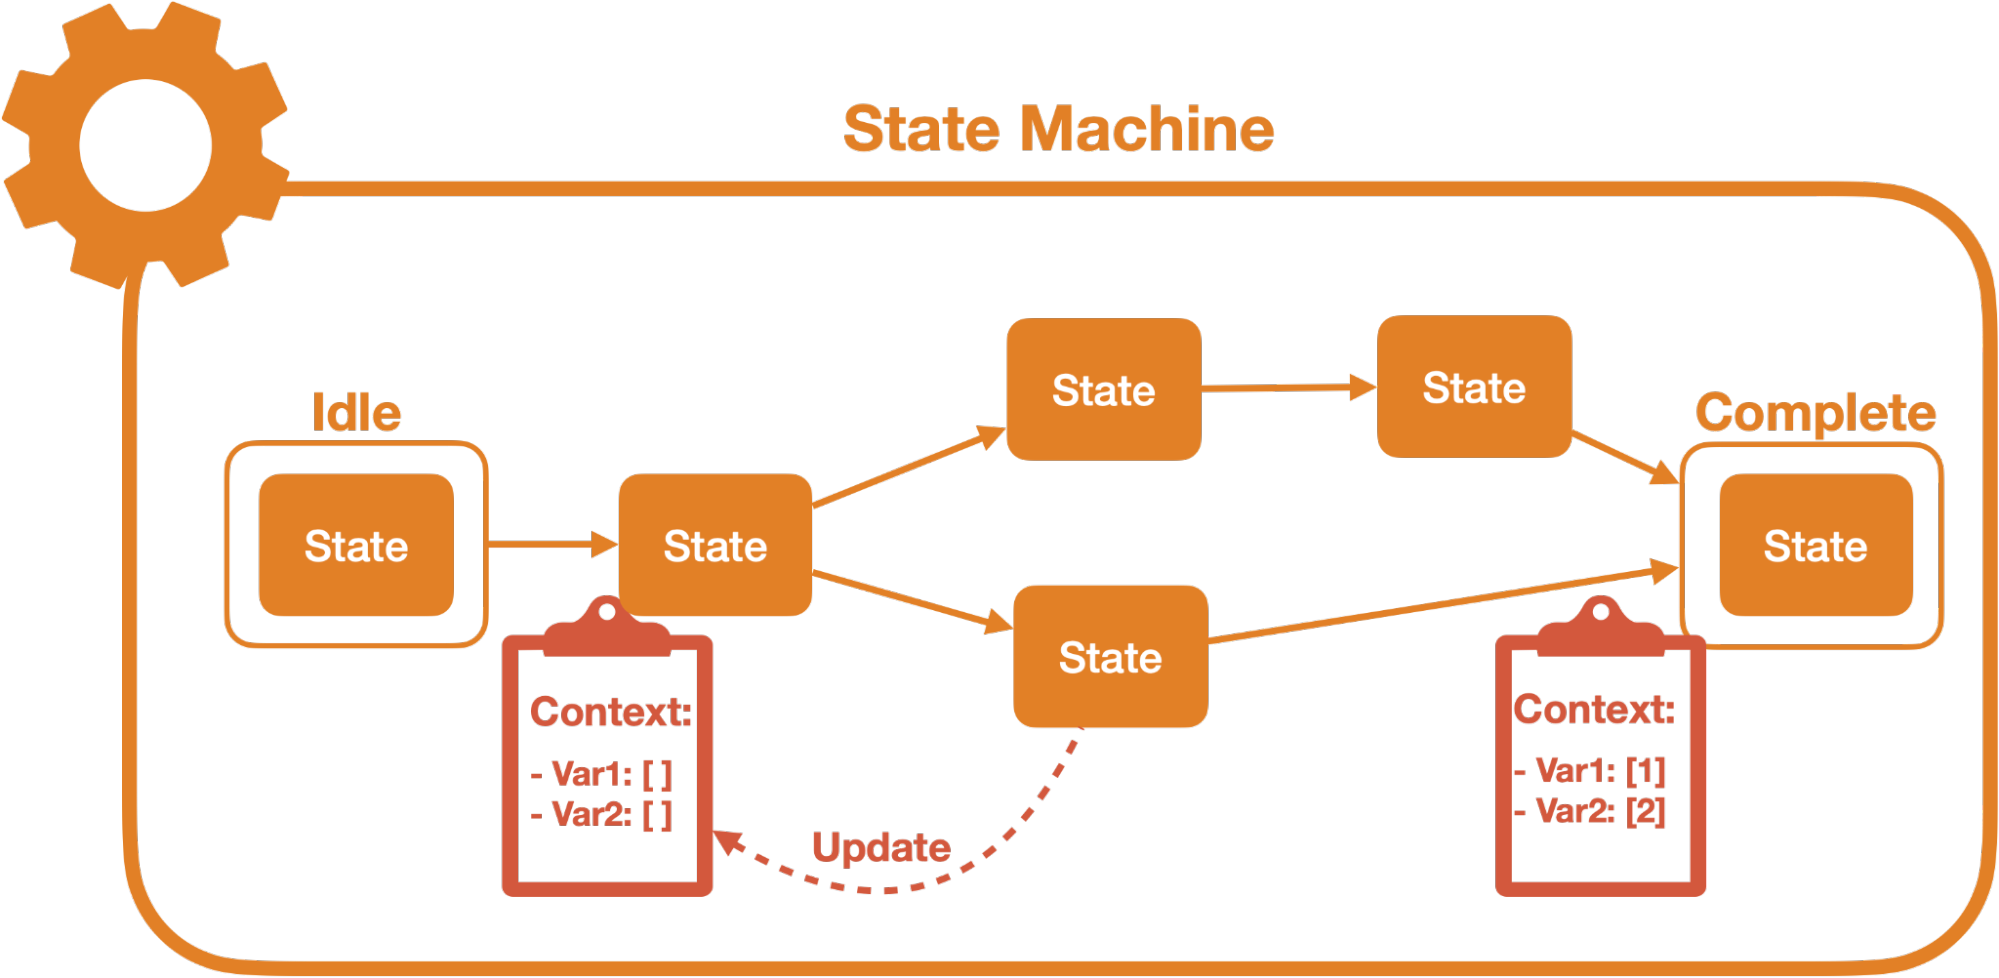
For the collection runner, we decided to use a state machine to keep track of the complex state we would have to navigate during the execution of a collection. A state machine helps declaratively model application logic by explicitly defining the states the application can exist in, the events that trigger changes between these states, and the transitions which represent the actions taken while moving from one state to another.12 A state machine would help us visualize the different paths through the stages of execution. It would also help us track, update, and pass around context easily through the different states of running a collection, such as referencing past responses and updating a request with interpolated values.
To implement a state machine, we used XState, a JavaScript library to create, manage, and interpret state machines. There was a learning curve, but we felt it was worthwhile.
When building the collection runner, our main challenge was structuring the collection runner module so that the code was comprehensible and efficient and took proper advantage of XState.
To begin with, we needed the collection runner to run on demand when triggered by user interactions or, eventually, a schedule. To that end, we added a simple Express server to the collection runner that would constantly run and listen for requests.
Next, we knew that executing a collection full of multi-step tests would require a series of steps to be performed upon each test, specifically processing the tests, executing the tests, and checking the assertions tests were complete. Each of these steps would, in turn, require its own substeps and different context values relevant to that step. Implementing all of this as one top-level state machine in XState would create a tangled labyrinth of states and context. Instead, for each test, the parent machine could cycle through a series of invoked child state machines; this would separate responsibilities for each execution task and isolate context values to the appropriate steps.
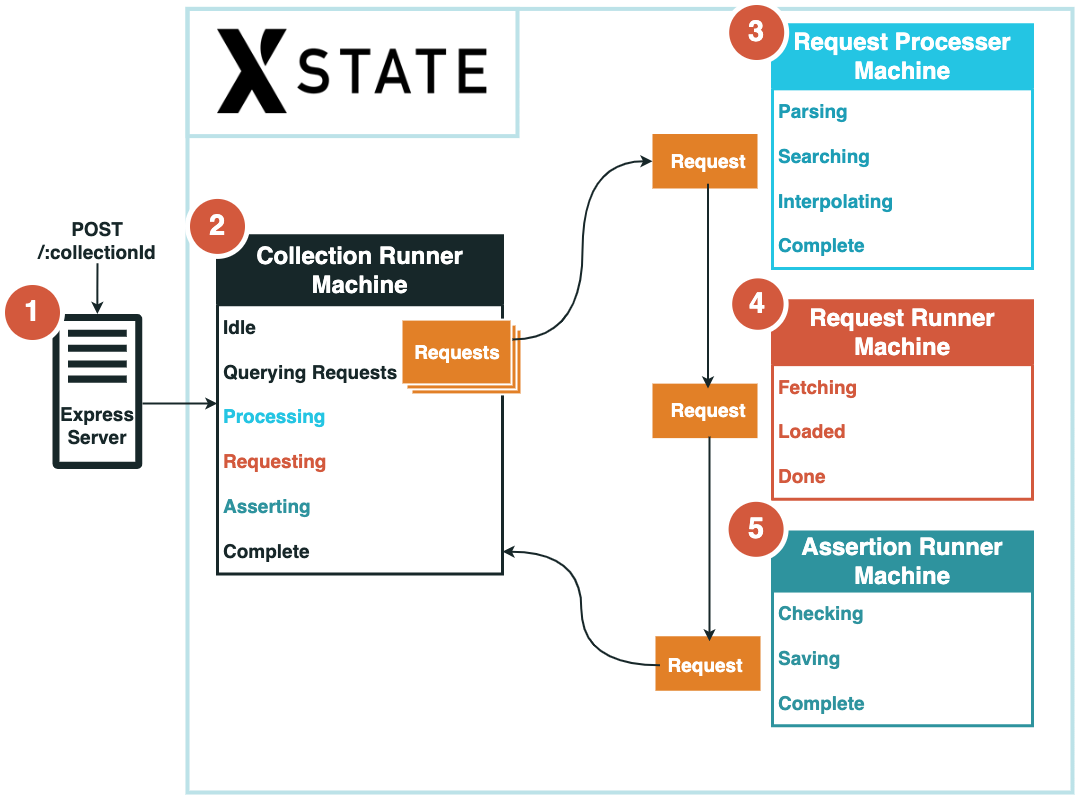
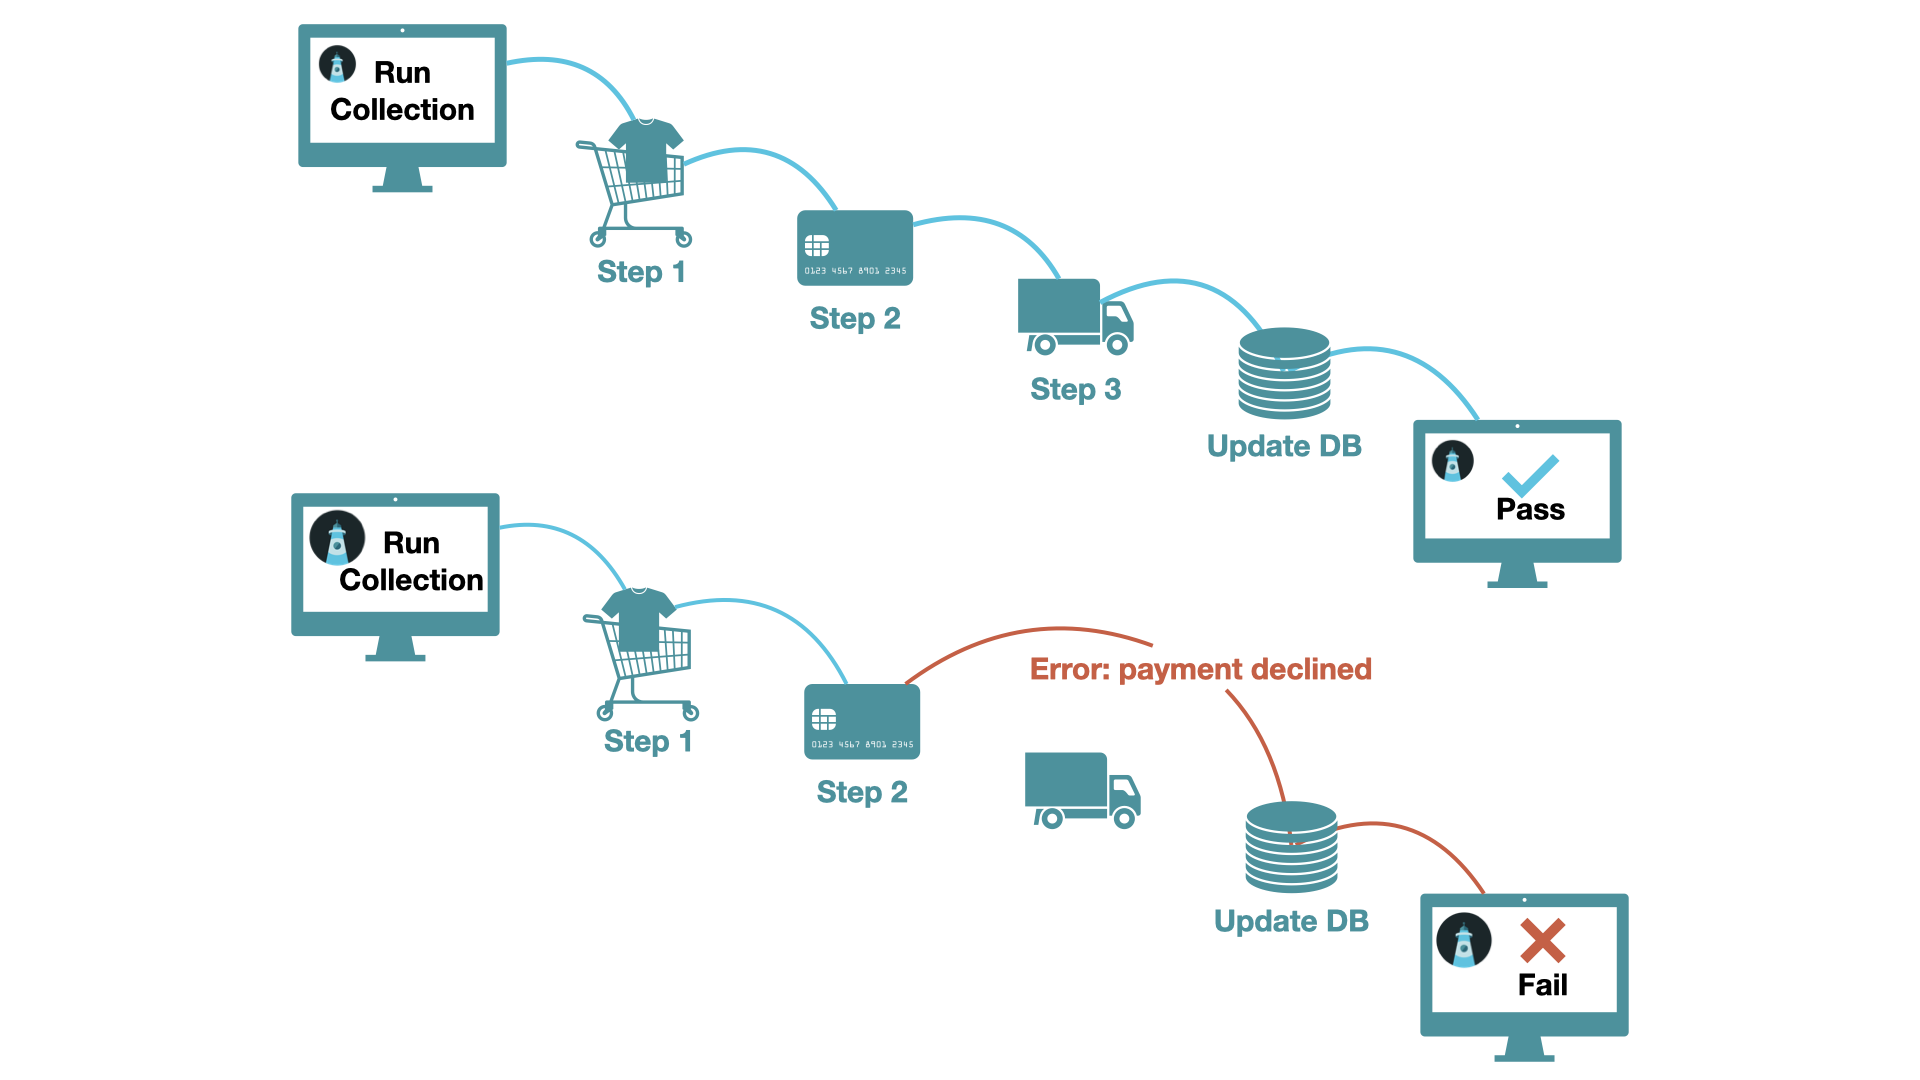
The diagram above illustrates the final process we settled on to execute a collection of tests:
Once all tests in a collection have been executed, the collection run is complete.
At this point, we had Skopos able to define and execute multi-step tests but unable to perform parallel testing, scheduling, or notifying. We decided to solve most of these problems at an infrastructure level.
Our cloud provider of choice was AWS, and the first step of taking advantage of cloud infrastructure involved moving to the cloud what we had already developed locally; we set up a Virtual Private Cloud (VPC) and began evaluating how to best accomplish this.
Some of these decisions were simple because we built Skopos with reliability in mind:
The execution component, however, required more careful consideration since we needed a way to run collections in parallel. Processing all collections on one virtual machine (VM), such as an Amazon EC2 instance, would not scale and would compromise the ability to run tests on a frequent schedule.
If running all collections on one single-tenant VM was the issue, then the simplest solution would be to provision multiple such VMs, each hosting its own collection runner process. This approach had the benefit of simplicity and reliability: a load balancer could direct traffic to available collection runner VMs, and if any collection runners suffered outages, then traffic could simply be routed to those still available.
However, it would still be a single-tenant solution which would be cumbersome for us for two reasons:
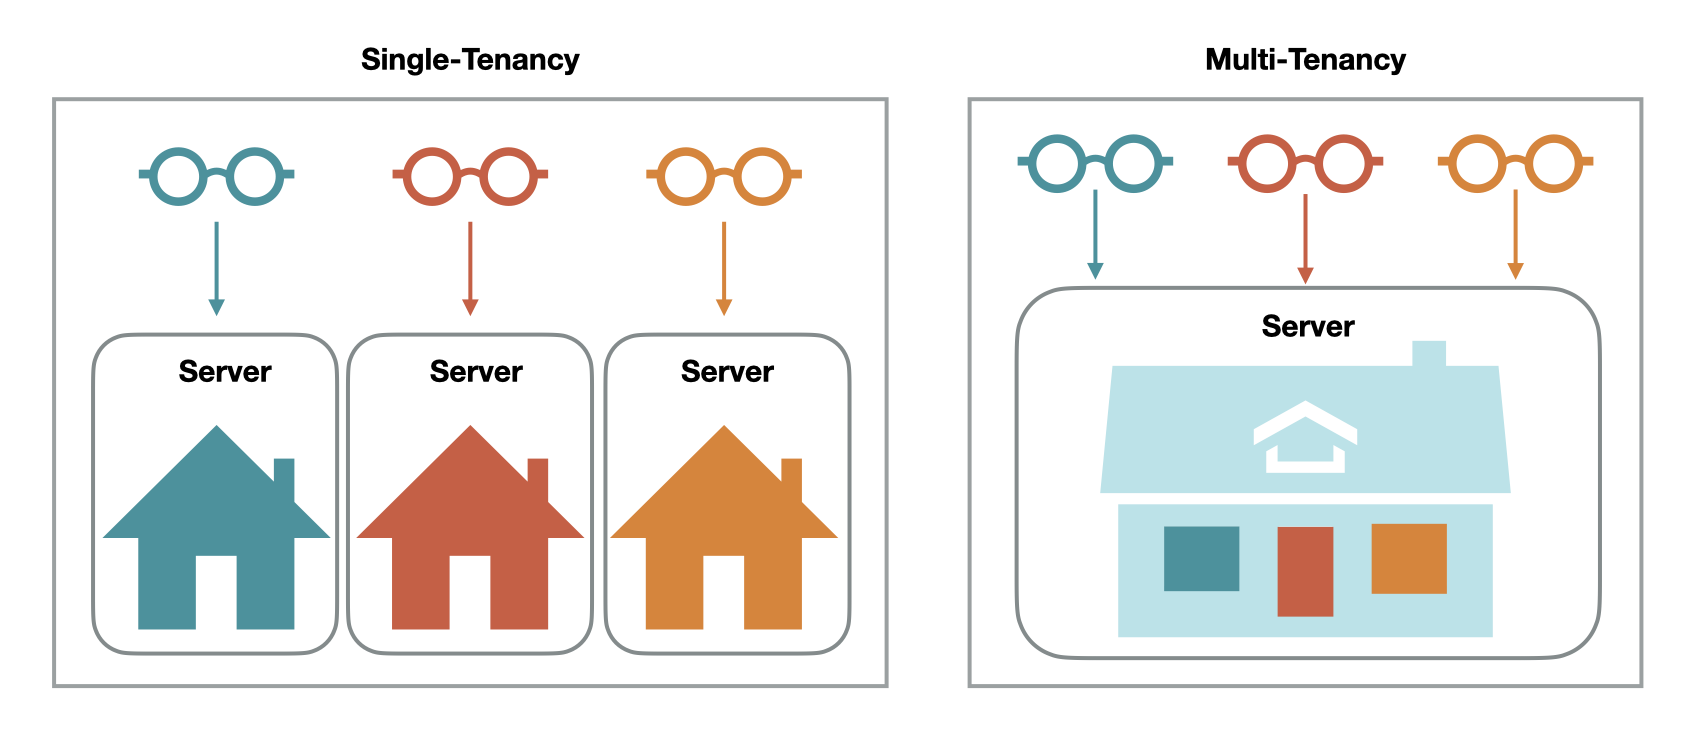
An alternative approach was to run the collection runner process inside a container. One benefit of cloud infrastructure is the ability to take advantage of multi-tenancy, where multiple instances of an application can share the same computing resources.13 By using containers, two main multi-tenant solutions opened up to us.
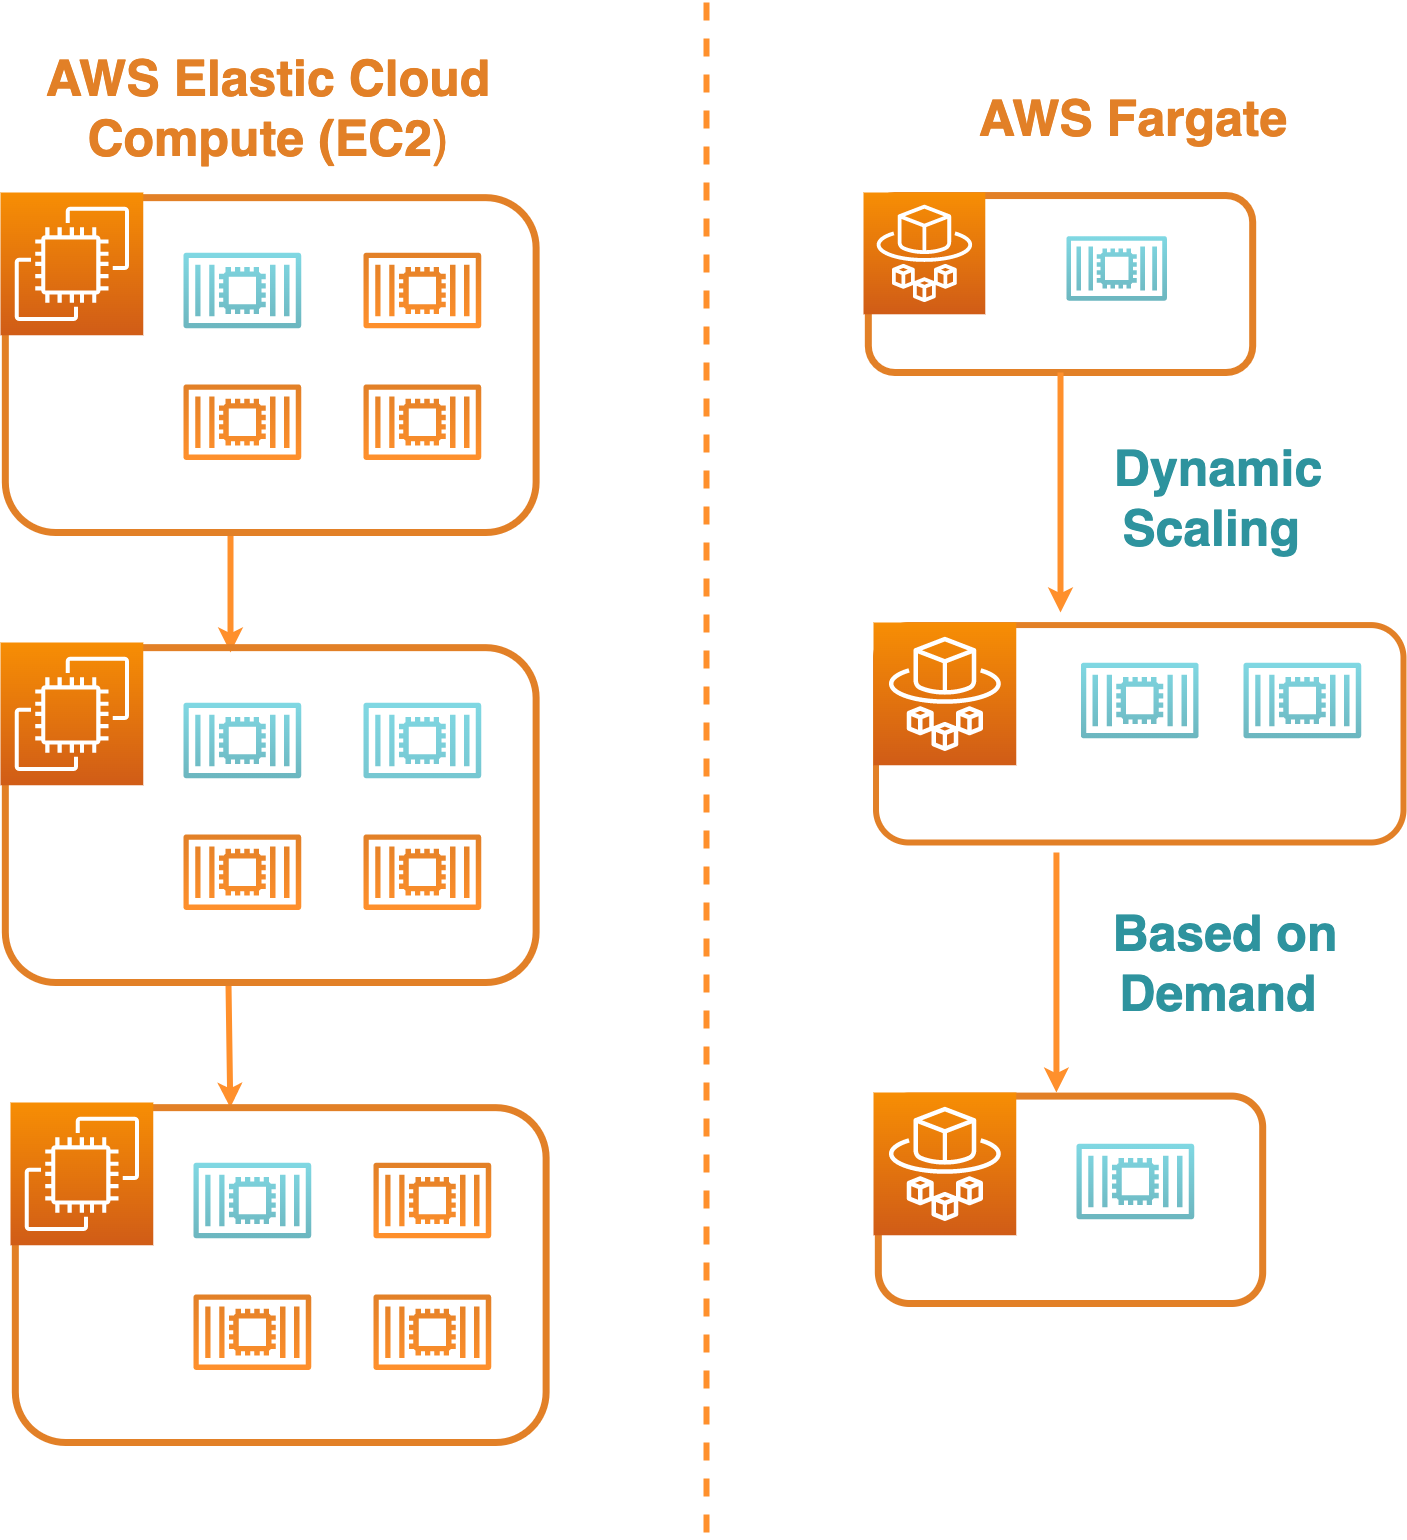
The first option was to host the containers through Amazon Elastic Container Service (ECS) on EC2 instances. With ECS, each EC2 instance could house multiple containers. One trade-off of this option was that we would still have to provision and manage VMs, but the resources of those VMs could be shared amongst many collection runner processes.
The second option was to employ AWS Fargate to host collection runner instances on serverless containers. In this case, as a serverless container service managed by AWS, Fargate would abstract away the complexity of managing host VMs; our containers would still be sharing resources with other applications, but AWS would manage the specifics of when and where to spin up or shut down the containers.
Fargate, though, had two main drawbacks to its use for us:
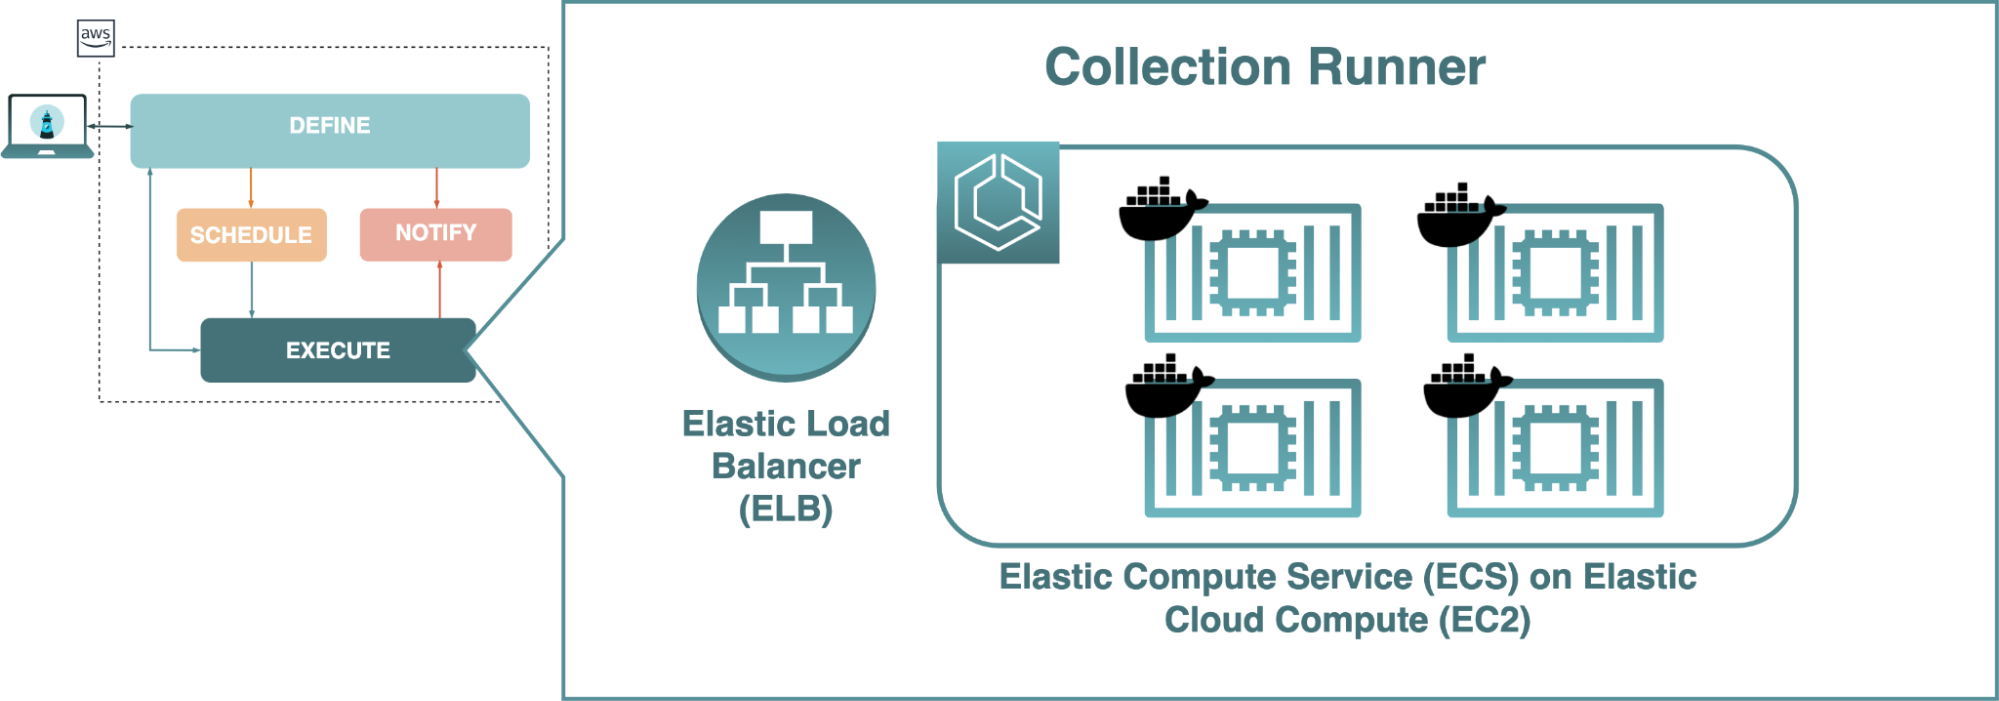
Ultimately, we decided on running collection runner containers on EC2 instances through ECS. Since our use case focused on small windows between collection runs, the multi-tenant solution of hosting multiple persistent containers on an EC2 instance would provide a cost-effective way to achieve parallel collection runs.
With parallel test execution successfully implemented, we moved on to automating the execution of tests.
With scheduling, we wanted to allow collections to run automatically on user-defined time intervals, such as every 5 minutes or every hour. Although allowing the user to specify their desired schedule was a simple matter of updating the front-end UI, how to manage those schedules on the backend required more consideration.
Specifically, we needed a solution that permitted schedules to be modified or deleted at will and could also communicate with the collection runner component to reliably trigger execution of tests as dictated by active schedules.
The first option was to run cron jobs from a Node.js process inside a docker container or EC2 instance. This approach would not require any additional infrastructure since the cron job logic could be co-located with the backend or collection runners.
However, this approach would have significant drawbacks:
While these issues could be sidestepped by building an entirely separate scheduling component that could run the Node.js cron jobs, that seemed like reinventing the wheel when we had a more straightforward, infrastructure-level solution we could leverage: Amazon EventBridge. EventBridge is a serverless event bus that can receive and route events based on user-defined rules, and these rules can include cron expressions that cause them to trigger on a schedule.
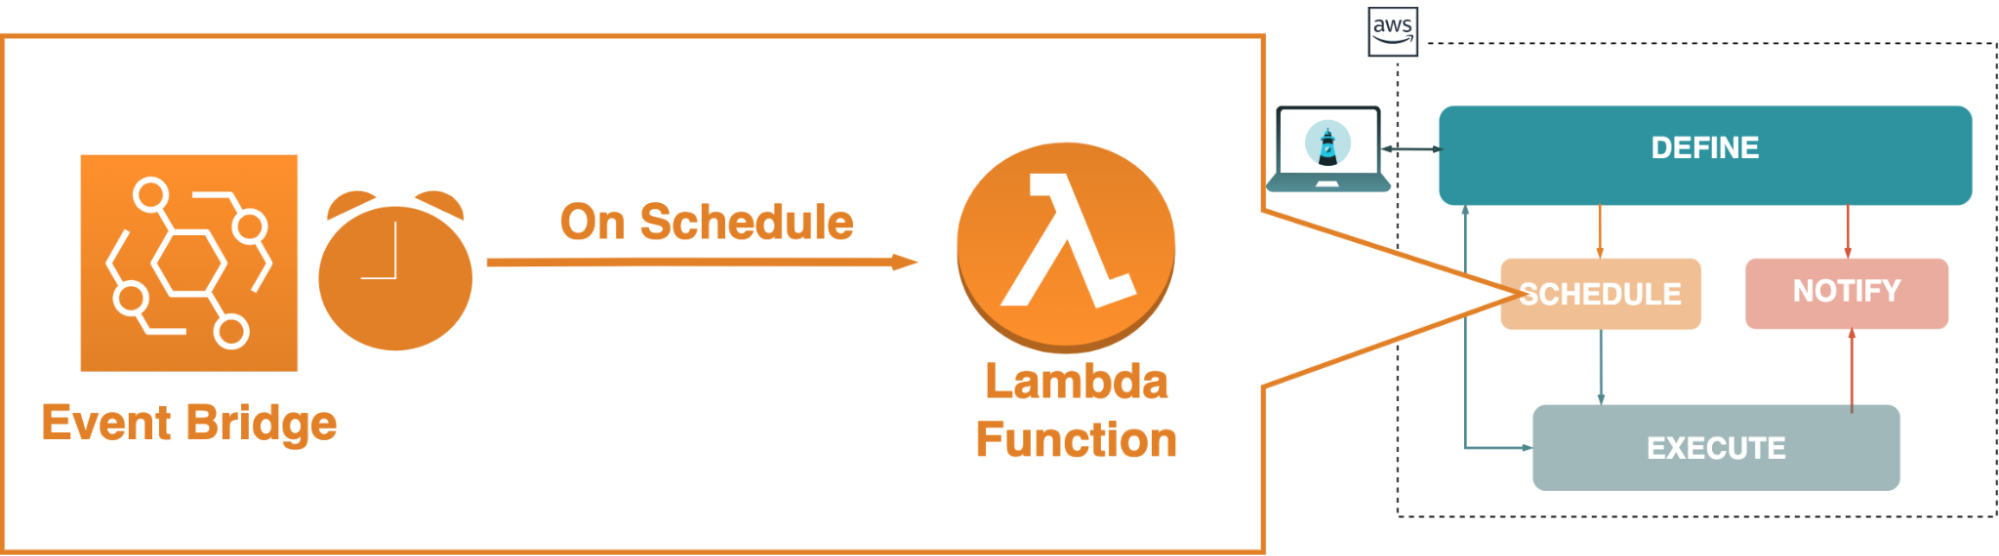
While EventBridge would still add a component to our architecture, it would decouple scheduling data from existing processes and prevent a loss of data were those to fail, and it would save us from needing to build an entire scheduling component ourselves from scratch. Since our aim with Skopos was to provide a fault-tolerant API monitoring tool, we decided to use EventBridge.
While implementing scheduling with EventBridge, we discovered that communication between the collection runner and EventBridge was somewhat problematic because they were not using the same communication protocol. The mismatch resulted from the collection runner running on HTTP while EventBridge required traffic on HTTPS.
If we wished EventBridge to still communicate directly with a collection runner, we would need the collection runner containers to maintain SSL certifications to allow for communication via HTTPS. This would avoid the need for any additional infrastructure. However, arranging for SSL certification for the collection runners’ containers would have introduced a number of its own complex engineering decisions just to address this one issue; we chose to look for a different solution in order to focus more time on other parts of our infrastructure.
On the other hand, we could design a Lambda function to act as an intermediary between EventBridge and the collection runner. This would be fairly simple to set up and maintain without the additional steps that come with registering domains and SSL certificates. However, we would be using HTTP in this case, which would not be as secure as HTTPS.
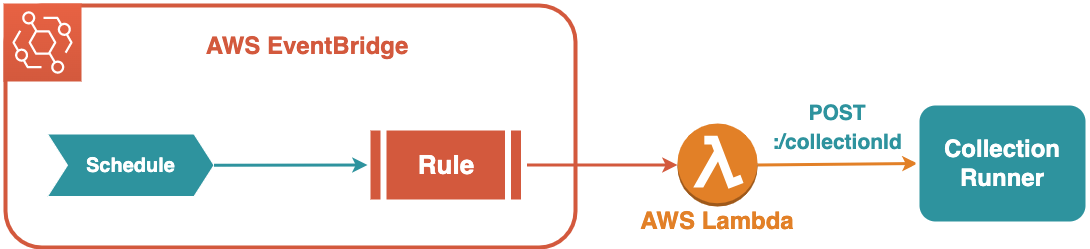
We decided the Lambda function was the better option. The communication in question was to occur entirely inside our VPC between EventBridge and the trusted code of our collection runner component, so we did not anticipate using HTTP rather than HTTPS to impose a security risk.
Now that we were able to schedule monitors that would regularly execute collection runs, the last piece of core API monitoring functionality to implement was notification.
AWS Simple Notification Service (SNS) was an easy choice for us to use for notifications. SNS had an effective setup for sending notifications to various services, such as PagerDuty and email. We were able to use the AWS SDK to integrate notification functionality.
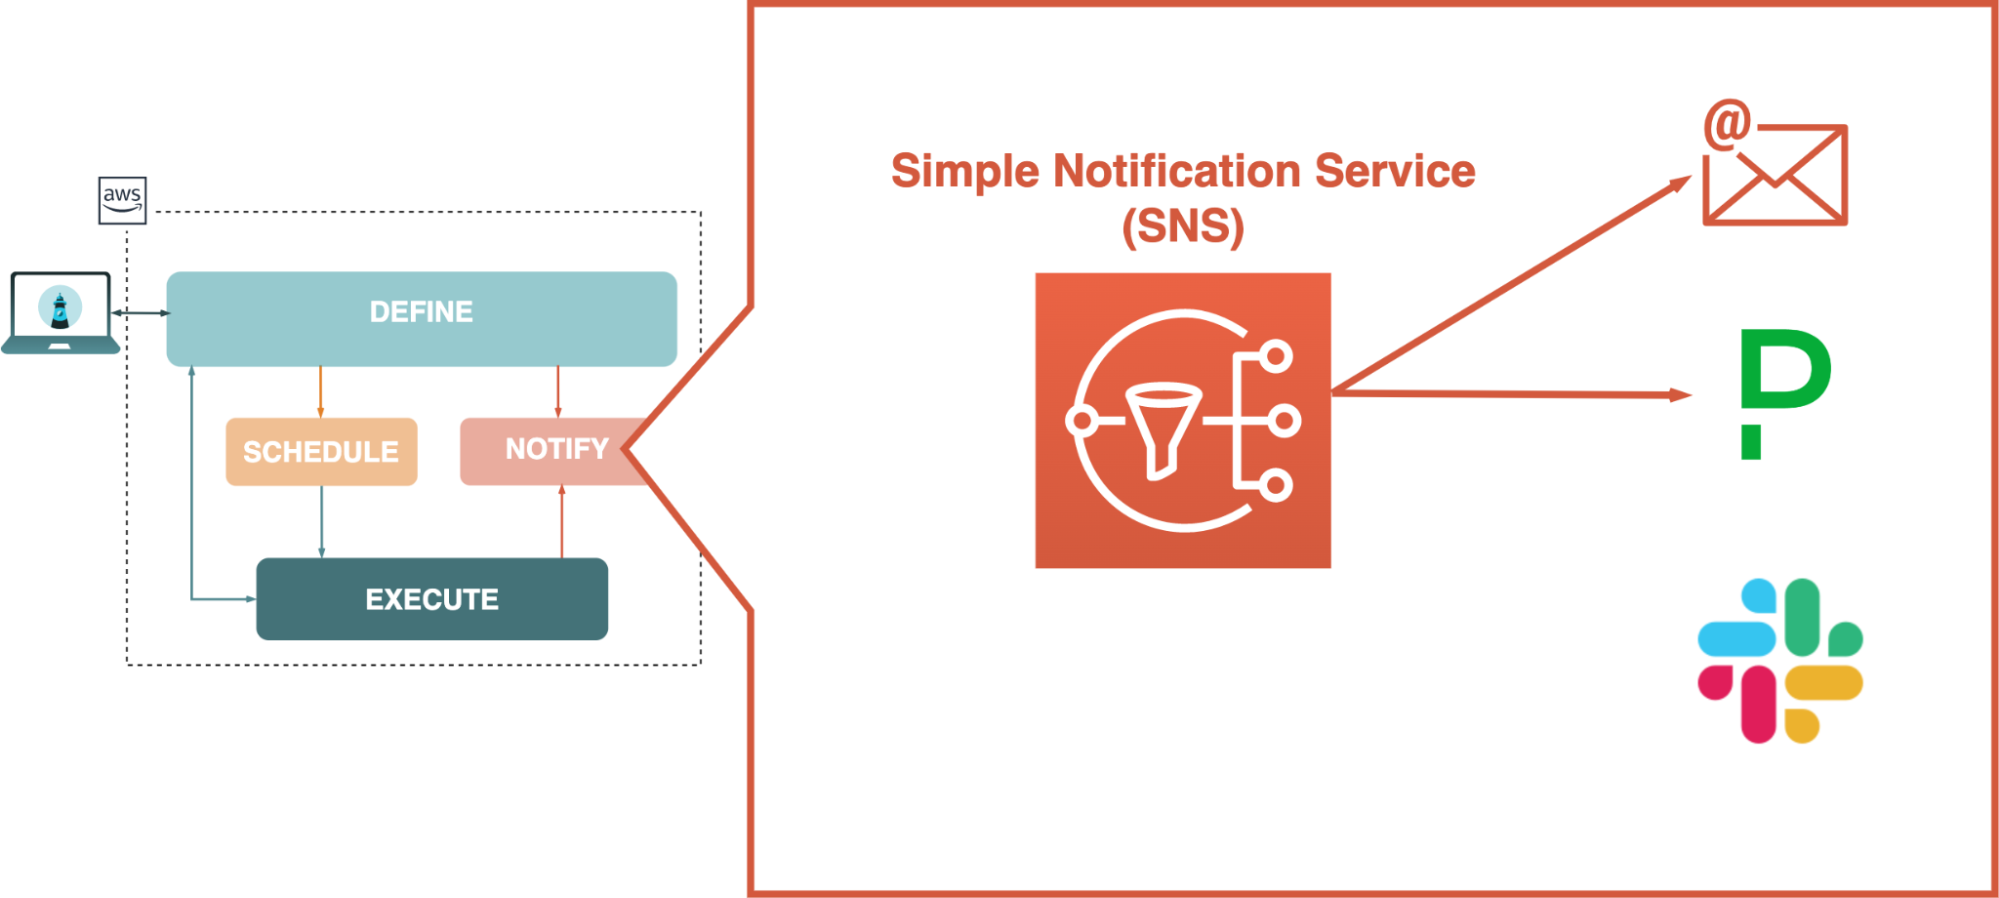
When a monitoring schedule was defined, SNS topics and subscribers were created using middleware in our backend application. In the collection runner, certain failure states would then publish a message to the appropriate SNS topic.
We wanted to provide functionality for sending notifications to Slack. However, Slack webhooks require a specific JSON body with a text property that SNS is not able to add. There are various workarounds for this, such as publishing a message to a subscribed Lambda function that sends a request to the webhook with the correct body. In our case, since our implementation goal was simple in that we just needed to send a basic POST request to the Slack webhook URL, rather than set up an extra Lambda function we decided to send these notifications with a different method. If a Slack webhook URL is added by the user, it is saved to the database when the monitor is created. The collection runner then saves the webhook URL to its state and sends a post request to that endpoint with the appropriate body if an error occurs.
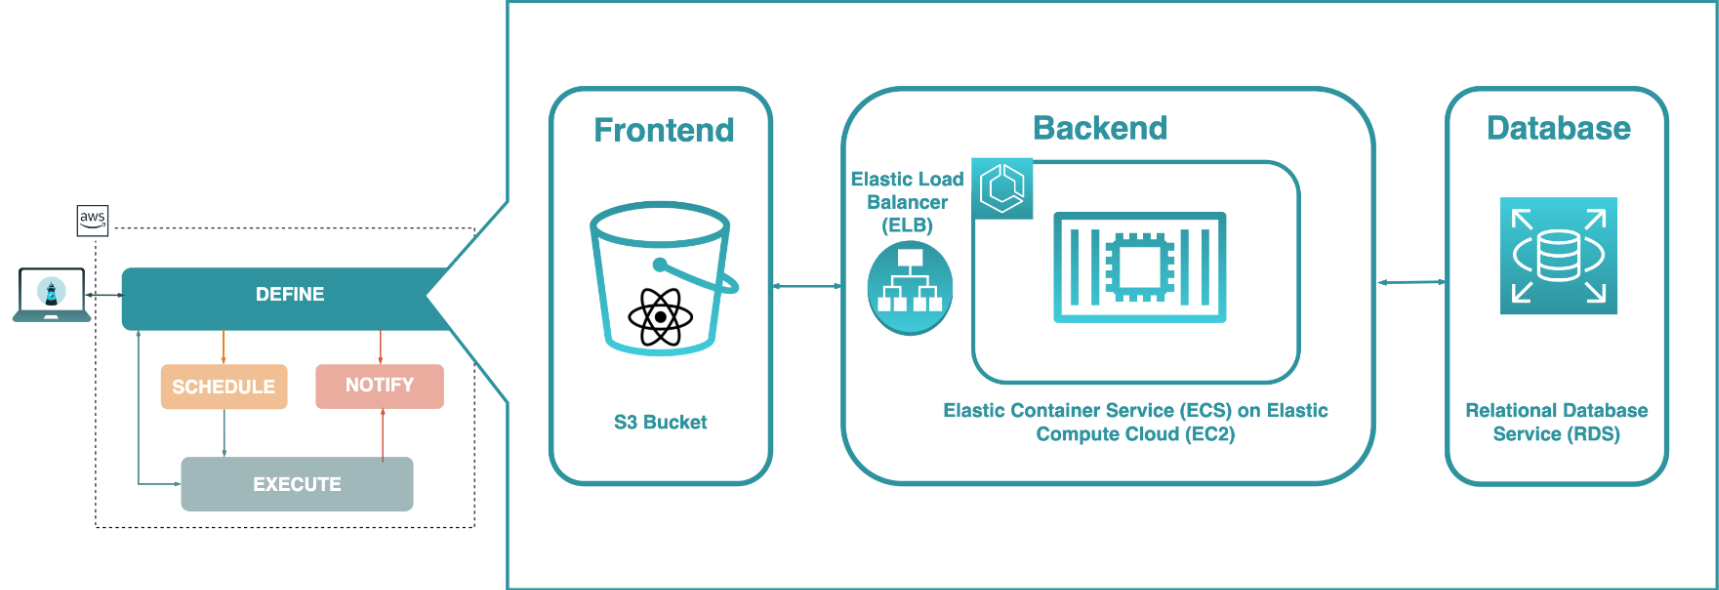
Once notification was successfully implemented, Skopos featured each of the core API monitoring functionalities we defined earlier. We can now review its completed architecture to appreciate how each piece of Skopos fits together.
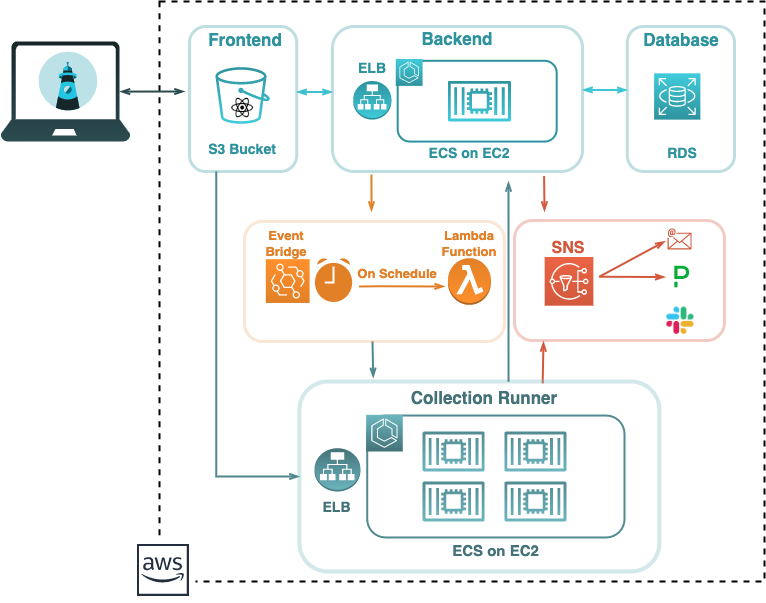
The application's backend, running in a container on an EC2 instance, uses GraphQL to act as a gateway between Skopos' PostgreSQL database running on RDS and the rest of the app. When a monitoring schedule is created for a collection, a rule is registered with EventBridge. When the EventBridge rule is triggered, it will send a message to a Lambda function, which will communicate with the collection runner component to begin the execution of the collection's tests. A collection run can also be initiated manually from the front end. The collection runner component is itself a cluster of collection runner processes running in containers managed by ECS and housed on an EC2 instance, with load balancing to direct execution tasks to available processes. When assertions fail, or errors occur, notifications are sent out via SNS.
We narrowed down the scope of Skopos for our specific use case. However, going forward, there are additional features we would like to include as well as improvements we would like to make to our current implementation.
More could be added to Skopos to provide a more robust API monitoring tool. Some features we would like to explore in the future include:
We are looking for opportunities. If you like our project, feel free to reach out!
Orange County, California
Green Cove Springs, Florida
California